回避癌症死亡,主动权大部分还是在大家自己的手上。
前不久,《柳叶刀》环球健康子刊抛出了一个重磅结论——中国每年大约有100万人因为完全可以避免的癌症而死亡,这个数据占中国癌症患者总死亡数据的45%左右!
在其刊发的相关研究中,首次出现了针对中国各省的全面的可避免的致癌因素分析——
吸烟的危害众所周知,可谓是健康的第一杀手。可是,你知道吗,生活中某些不健康习惯造成的危害,也不亚于吸烟!

日前,国家癌症中心/中国医学科学院肿瘤医院赫捷院士和陈万青教授牵头发表在《柳叶刀——全球健康》上的重磅论文,专门针对中国人群,分析了23种主要致癌风险导致的不同癌种在我国的发病比例。更牛的是,还分析了在全国各省市自治区因各种致癌风险导致的患癌比例,给我们敲响了警钟!面对身边这些隐形杀手,我们该如何积极应对,逐一击破呢?
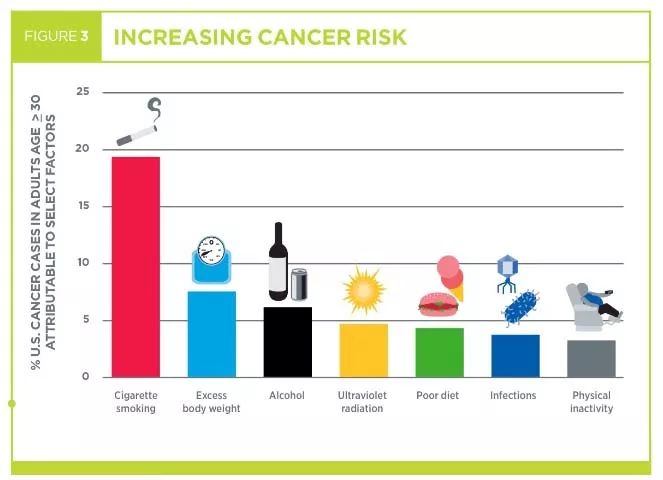
中国癌常见的23个致癌因素
行为因素4种
吸烟、二手烟、饮酒、缺乏锻炼
饮食因素7种
摄入不足:水果、蔬菜、膳食纤维、钙
摄入过多:红肉、加工肉类制品、腌菜
代谢因素2种
体重超标、糖尿病
环境因素2种
PM 2.5 污染、紫外线辐射
感染因素8种
1种细菌:幽门螺旋杆菌;
6种病毒:乙肝病毒(HBV)、丙肝病毒(HCV)、人乳头状瘤病毒(HPV)、EB病毒(EBV)、人类免疫缺陷病毒(HIV)、人类疱疹病毒 8 型(HHV - 8)
2种寄生虫:华支睾吸虫(肝吸虫)
各省市各致癌因素导致患癌风险比例
由 23 种可避免的导致癌症因素所占比例排名,从高到低,前五分别是黑龙江、广东、吉林、湖北、内蒙古;比例最低的五个是甘肃、云南、新疆、西藏和上海,其中上海只有 35.2% 的癌症死亡,是全国最低。
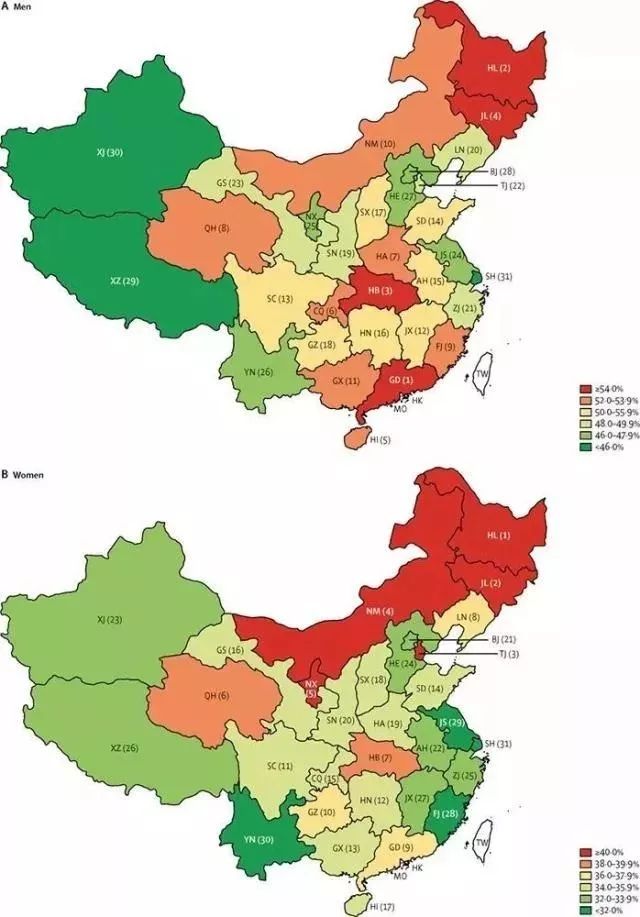
而在20岁及以上成人中,中国每年有103.6万人死于23种主要致癌因素引起的各种癌症,占全部20岁及以上癌症死亡人数(约为229万人)的45.2%。但是,只要防控好这23种致癌因素,这103.6万人是可以避免死亡的。
做到这七点,击破23大隐形杀手!
研究表明,这些致癌风险是可以避免的,这意味着将近103.6万例可预防的癌症。我们该如何做呢?
1戒烟是头等大事!
显然,关于吸烟的最佳预防癌症策略是永远不吸烟。
全国有6个省市自治区的女性最大风险是吸烟,包括黑龙江、吉林、辽宁、天津、内蒙古、安徽。一直以来,东北的女性肺癌发病率都比较高,这和她们吸烟率高密切相关。在贵州和云南,男性吸烟的比例占到了62.1%和61.4%,而这两个省也恰好是财政收入对烟草行业依赖比例最高的省份。
对于现有的吸烟者来说,“降低风险的程度取决于您吸烟的年数以及戒烟前抽取的香烟数量。如果吸烟不到五年(每天不超过一包),癌症风险较低,只要你戒烟,你就会降低风险,获得健康的好处。
吸烟者经常反驳:“我知道从不吸烟的人,仍然会得肺癌。我为什么要戒烟呢?”然而,科学现实是,吸烟越少,罹患肺癌的机会越少。如果大家采取低风险群体的生活习惯,尤其是戒烟,可以避免大约80%到90%的肺癌死亡。1991年以来,美国癌症死亡率降低了26%,其中一半以上归因于吸烟率的下降。
建议:
▍① 戒烟对任何年龄阶段的人都有益。
▍② 吸烟导致人均寿命缩短十年以上。
▍③ 如果40岁以前戒烟,可以夺回9年寿命。
2限酒,任何饮酒都有害
酒精是一类致癌物,每18个癌症里面就有1个和喝酒相关。有充分证据表明酒精会升高口咽、喉、食管(鳞)、胃、肝、结直肠、乳腺发生癌症的风险,还有部分研究显示酒精还可能导致肺癌、胰腺癌和皮肤癌。
西藏、内蒙古皆以喝酒豪爽著称,饮酒导致癌症比例排名第一、二位;宁夏比例全国最低,只有9%,巧的也是回族不喝酒。
《中国居民膳食指南》(2016)建议,男性一天饮用酒精量不超过25克,女性不超过15克,否则即为饮酒过量。
25克酒精量是什么概念?大概换算下,记住:
▍白酒:每次不要超过1两
▍啤酒:每次不要超过一瓶
▍红酒:每次限制在一红酒杯左右
3控制体重
肥胖不仅会增加患心脏病、糖尿病、骨质和关节疾病的风险,还会增加患癌症的风险。这里尤其要提到胰腺癌,它不仅和肥胖有关,还跟糖尿病有关。胰腺癌整体在发达地区发病率更高,北京女性中,有 6.7% 和糖尿病相关,是全国最高的地区;而山西、江西和广西的比例都要低很多,比如江西只有 1.5% 的女性胰腺癌和糖尿病有关。
详细:各种癌症与肥胖的关系↓↓↓
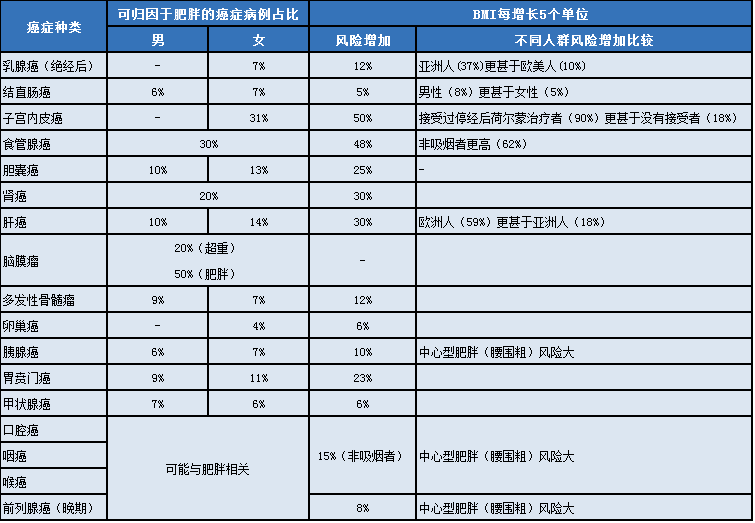
体重最保持在标准BMI(身体质量指数)内,即18.5~23.9。

此外,男性腰围要控制在90厘米以内;女性腰围不应该超过80厘米。
4健康饮食
培根、火腿、香肠、热狗都被世界卫生组织列为第一组致癌物。食用加工过的肉类会增加18%的结肠直肠癌风险。红肉也会缩短人的寿命,增加患结肠癌的风险,特别是当肉被烤或烧烤,甚至是轻微烧伤的时候。虽然红肉的致癌风险远不及吸烟的风险高,但减少红肉的摄入量,并限制食用加工肉类只会降低你患癌症的风险。
从中国整体来看,排第一的致癌风险因素是水果蔬菜摄入不足,占了15.6%,它也是全国14个省的女性第一大风险因素。
《中国居民膳食指南》推荐每天吃 300~500 克蔬菜,200~350 克新鲜水果。这里要刻意强调一下蔬菜应为“非淀粉类蔬菜”,即不以淀粉为主的蔬菜,包括各类叶菜、十字花科蔬菜(如西兰花)、秋葵、茄子等都是非淀粉类蔬菜,但是不包括土豆、红薯、山药这类根茎类食物。
有研究显示非淀粉类蔬菜和水果可以降低诸多上呼吸消化道肿瘤的风险,诸如口腔、鼻咽、食管、肺、胃和结直肠的肿瘤发病风险。
5运动、运动、运动
体育锻炼不仅有助于减肥或保持体形,而且对癌症也有预防作用。运动似乎降低了激素水平,改善了我们的免疫系统功能,降低了胰岛素和胰岛素样生长因子的水平,也降低了身体脂肪。
研究表明,每天至少进行30-60分钟的中等到高强度体育锻炼的人患癌症的风险会降低,尤其是乳腺癌和结肠癌的风险。此外,其他几种癌症的发病率也有所下降,包括前列腺癌、肺癌和子宫内膜癌。
为了预防癌症,美国运动指南建议:
▌成年人每周至少应进行150分钟中等强度有氧运动(如快走);
▌或75分钟高强度运动(如慢跑);
▌或等量的两种运动组合。
6远离11种病原体
我们上文提到了中国常见的8种感染致癌因素,对于一般生活中常见的感染,我们建议:
▍① 宫颈癌——HPV人体乳头状瘤病毒
途径:性传播途径、密切接触、间接接触(感染者的衣物、生活用品、用具等)、医源性感染、母婴传播。
预防:接种HPV疫苗、注意个人卫生、注意性生活卫生。有过性行为的女性,最好每年做一次筛查。
提醒:感染HPV早期无明显症状,引起宫颈病变后,可能出现性生活接触性出血、白带增多有异味、经期延长月经量增多等,要及时就医。
▍② 胃癌——幽门螺旋杆菌
途径:口腔唾液、粪便经手、食物接触口
预防:餐前要洗手,尽量不要喂送食物,尤其不要口口喂养幼儿。可以分餐制或公筷,且餐具经常消毒。
提醒:如果出现口臭、泛酸、胃痛等症状的患者,应做胃镜和hp感染筛查。
▍③ 肝癌——乙肝和丙肝病毒、肝吸虫
途径:血液传播、母婴传播、性传播、生吃淡水鱼虾等
预防:接种乙肝丙肝疫苗;在献血或输血时去正规医疗机构;做好婚检孕检;少吃生的淡水鱼虾。
提醒:慢性乙肝、丙肝患者可能出现乏力、食欲不振、消化不良等症状,切不可轻视。
▍④ 鼻咽癌——EB病毒
途径:唾液传播
预防:接种EB疫苗,注意避免口对口传播和喷嚏飞沫传播。
7进行癌症筛查
对于大多数癌症来说,如果能及早发现并治疗,存活就会更大。要定期进行以下癌症筛查:
乳腺癌筛查、宫颈癌筛查、结肠直肠癌筛查、丙型肝炎病毒筛查、艾滋病毒筛查、肺癌筛查、肥胖等。
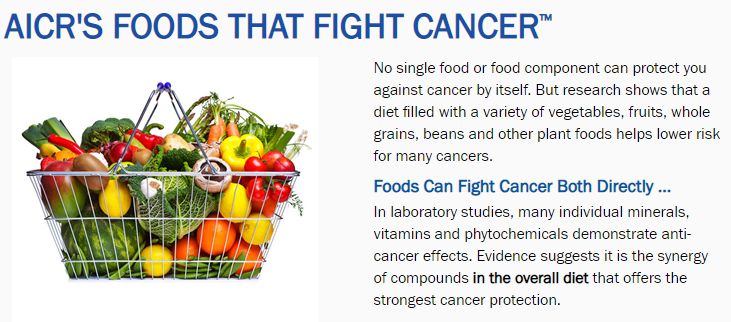
食物中蕴含着大量的营养物质,也许能够抗氧化,也许能够减轻肥胖,从而减低肿瘤的风险等等。但是具体是哪些食物呢?
权威机构美国癌症研究所发布的证据证明,蔬菜、水果、全谷物、豆类等可以降低很多癌症风险。

01 苹果苹果富含膳食纤维和维生素C,一个苹果能为人体提供至少10%的每日维生素C和纤维的推荐量。膳食纤维可以通过多种方式降低肿瘤风险,包括帮助控制体重(膳食纤维会增加饱腹感)。肠道细菌可以使用果胶(苹果膳食纤维的主要部分)来产生保护结肠细胞的化合物。
苹果的“抗癌”能力:
对预防结直肠癌、口腔癌、喉癌、肺癌有一定帮助。
02 蓝莓蓝莓是维生素C、钾、锰等营养物质的良好来源,也有花青素,儿茶素,槲皮素,山奈酚和其他类黄酮,以及鞣花单宁、鞣花酸、紫檀芪和白藜芦醇等植物化学物质,并且有许多物质已在实验室中得到了很好的研究。蓝莓中含有的膳食纤维,可以通过多种方式降低肿瘤风险。
蓝莓的“抗癌”能力:
对预防结直肠癌、腔癌、喉癌、肺癌有一定帮助。
03 西兰花等十字花科蔬菜西兰花是最有名的十字花科蔬菜,其他有名的还有球芽甘蓝、油菜花、卷心菜、花椰菜、白萝卜等。十字花科蔬菜完全不含淀粉。几乎每种十字花科蔬菜都含有丰富的维生素C、锰,一些深绿色的蔬菜还含有维生素K。
西兰花等十字花科蔬菜的“抗癌”能力:
对预防结直肠癌、口咽癌、喉癌、肺癌有一定帮助。
04 胡萝卜胡萝卜是饭桌上常见的配菜。胡萝卜的抗癌能力来自于它是一种非淀粉类蔬菜,也是类胡萝卜素(如β-胡萝卜素)和其他植物化学物质的来源。
胡萝卜的“抗癌”能力:
降低结患直肠癌风险。对预防口腔癌、喉癌、肺癌、乳腺癌症有一定帮助。
05樱桃无论是酸樱桃还是甜樱桃都富含维生素C和膳食纤维,还有矿物质钾。酸樱桃中还含有维生素A。花青素使它们拥有抗氧化能力和鲜艳的颜色。
樱桃的“抗癌”能力:
对预防结直肠癌、口腔癌、喉癌、肺癌有一定帮助。
06咖啡目前,咖啡目前已经被移除“2B类致癌物”名单,关于咖啡的抗癌机制目前仍不是特别明确。但总体来说,其中含有维生素B和植物素,有抗氧化作用。
咖啡的“抗癌”能力:
对预防子宫内膜癌、肝癌有一定帮助。
07蔓越莓蔓越莓天然的抗坏血酸作用长期以来受到水手、航海者的青睐。因为蔓越莓汁可以预防尿路感染。同样是富含维生素C和膳食纤维。花青素、熊果酸、苯甲酸等,使它有极强的抗氧化能力。
咖啡的“抗癌”能力:
对预防结直肠癌、口咽癌、喉癌、肺癌有一定帮助。
08 深绿色蔬菜菠菜,羽衣甘蓝,生菜,芥菜,菊苣和瑞士甜菜都含有一些纤维素,叶酸和各种类胡萝卜素,如叶黄素和玉米黄素,以及皂角苷和类黄酮。
深绿色蔬菜的“抗癌”能力:
对预防结直肠癌、口咽癌、喉癌、肺癌有一定帮助。
09 豆类(豌豆、扁豆)豆类富含纤维素、植物素、蛋白质,还能提供优质叶酸和维生素B。能从多个方面表现抗癌作用。
豆类的“抗癌”能力:
对预防结直肠癌有一定帮助。
10亚麻籽亚麻籽含有优质镁、锰、维生素B1、膳食纤维,富含矿物质硒,还能提供蛋白质和微量元素铜。亚麻籽富含植物类雌激素如木脂素,因此很多研究都集中在其能预防乳腺癌上,近年来还有研究亚麻籽在前列腺癌和结肠癌中的作用。
亚麻籽的“抗癌”能力:
对预防结直肠癌有一定帮助。
11大蒜大蒜属于葱属植物,其中还包括洋葱,葱,韭菜。根据AICR的第二版专家报告及其更新,大蒜可能可以预防结肠直肠癌。
大蒜的“抗癌”能力:
对预防结直肠癌有一定帮助。
12葡萄柚葡萄柚满满都是维生素和植物素,一只柚子就能提高成年人一天所需的维生素C。低卡路里和酸酸甜甜的味道也足以使它风靡全球。
葡萄柚的“抗癌”能力:
对预防结直肠癌、口咽癌、喉癌、肺癌有一定帮助。
13葡萄和葡萄汁葡萄和葡萄汁都是白藜芦醇的丰富来源,这是一种具有抗癌作用的植物化学物质。葡萄的表皮含有最多的白藜芦醇。
白藜芦醇的“抗癌”能力:
部分实验室研究指出,白藜芦醇能够减缓癌细胞的生长并抑制淋巴、肝脏、胃和乳腺细胞中肿瘤的形成。
14大豆大豆含有丰富的植物性雌激素,膳食纤维、钾、镁、铜、锰、铁等。大豆还是多不饱和脂肪酸ω-6和ω-3的优质来源。
大豆的“抗癌”能力:
对预防结直肠癌有一定帮助。
15 冬南瓜产于美国本土的冬南瓜有着不同于夏南瓜(俗称西葫芦)的硬皮,皮有多种不同的纹理,风味各异。冬南瓜含有优质维生素A,丰富的维生素C、类胡萝卜素、钾和膳食纤维。
冬南瓜的“抗癌”能力:
对预防结直肠癌、口咽癌、喉癌、肺癌有一定帮助。
16 茶此处推荐的茶是传统意义上的来源于植物树叶的白茶、绿茶、黑茶、乌龙茶。茶中的营养素也取决于茶的种类。总体上说,茶中含有咖啡因、儿茶酚、茶红素和茶黄素等。研究更多的集中在绿茶与癌症上面,因为绿茶中有丰富的表没食子儿茶素没食子酸酯(EGCG)。
茶的“抗癌”能力:
对预防前列腺癌和结肠直肠癌有一定帮助。
17西红柿西红柿历来引起前列腺癌研究人员的特别关注,因为番茄红素及其相关化合物往往集中在前列腺组织中。番茄红素是一种强大的抗氧化剂。西红柿对肿瘤的预防作用,来源于它是非淀粉类蔬菜以及富含维生素C和类胡萝卜素。
西红柿的“抗癌”能力:
在多个实验室研究中显示出抗癌潜力,可阻止几种癌细胞的增殖,包括前列腺癌,乳腺癌,肺癌和子宫内膜癌。
18核桃在所有的坚果类食物中,富含ω-3的核桃抗癌的作用被研究的最多。核桃中的亚麻酸、鞣花酸、类黄酮都是实验室里受欢迎的抗癌成分。
核桃的“抗癌”能力:
动物实验显示其能减慢乳腺癌和前列腺癌的进展速度。
19全谷物包括糙米、燕麦片、玉米、全麦面包、大麦、荞麦、干小麦、小米、高粱等。全麦食物中含完整的营养素,包括膳食纤维的麸类、淀粉胚乳等。
全谷物的“抗癌”能力:
对预防结直肠癌有一定帮助。
这些天然的防癌食物以后可多吃!
本文参考资料:
AICR'S FOODS THAT FIGHT CANCER?,American Institute for Cancer Researchhttp://www.aicr.org/foods-that-fight-cancer/

2019年1月,国家癌症中心发布了最新一期的全国癌症统计数据。全国肿瘤登记中心负责全国肿瘤登记数据收集、质量控制、汇总、分析及发布工作。(由于全国肿瘤登记中心的数据一般滞后3年,本次报告发布数据为全国肿瘤登记中心收集汇总全国肿瘤登记处2015年登记资料。)
恶性肿瘤(癌症)已经成为严重威胁中国人群健康的主要公共卫生问题之一,根据最新的统计数据显示,恶性肿瘤死亡占居民全部死因的23.91%,且近十几年来恶性肿瘤的发病死亡均呈持续上升态势,每年恶性肿瘤所致的医疗花费超过2200亿,防控形势严峻。
一、报告主要发现
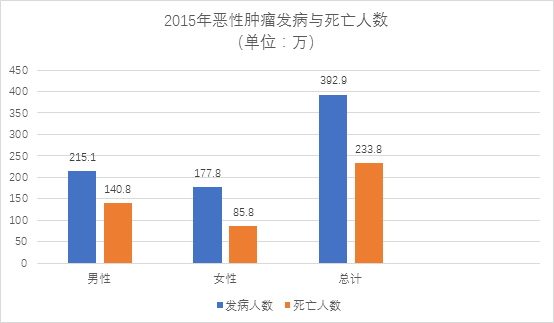
2015年恶性肿瘤发病约392.9万人,死亡约233.8万人。平均每天超过1万人被确诊为癌症,每分钟有7.5个人被确诊为癌症。与历史数据相比,癌症负担呈持续上升态势。近10多年来,恶性肿瘤发病率每年保持约3.9%的增幅,死亡率每年保持2.5%的增幅。
肺癌、肝癌、上消化系统肿瘤及结直肠癌、女性乳腺癌等依然是我国主要的恶性肿瘤。肺癌位居男性发病第1位,而乳腺癌为女性发病首位。男性恶性肿瘤发病相对女性较高,且发病谱构成差异较大。甲状腺癌近年来增幅较大,在女性恶性肿瘤发病谱中目前已位居发病第4位。男性前列腺癌近年来的上升趋势明显,已位居男性发病第6位。
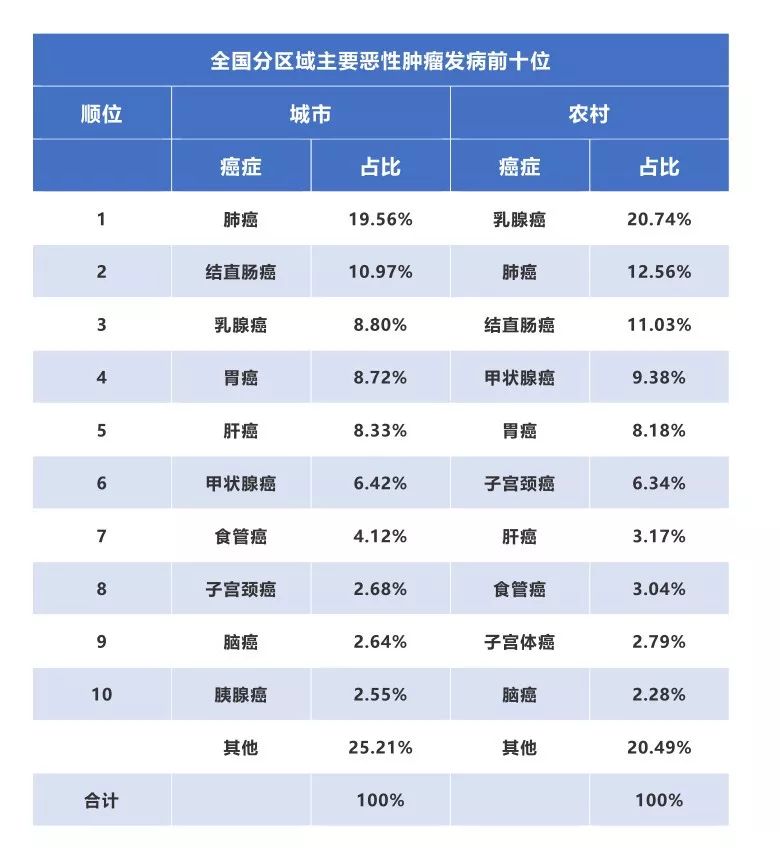
城乡恶性肿瘤发病水平逐渐接近,恶性肿瘤负担差异仍然较为明显,表现在城市恶性肿瘤发病率高于农村,而农村恶性肿瘤死亡率高于城市。这可能与城乡癌谱构成差异有关,农村地区主要癌种以上消化系统肿瘤如食管癌、胃癌、肝癌等预后较差的恶性肿瘤为主,城市地区则以结直肠癌和乳腺癌等恶性肿瘤高发。
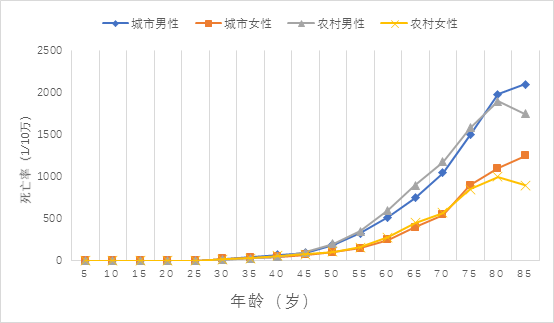
从年龄分布看,恶性肿瘤的发病随年龄的增加而上升。40岁以下青年人群中恶性肿瘤发病率处于较低水平,从40岁以后开始快速升高,发病人数分布主要集中在60岁以上,到80岁年龄组达到高峰。不同恶性肿瘤的年龄分布均有差异。
在过去的10余年里,恶性肿瘤生存率呈现逐渐上升趋势,目前我国恶性肿瘤的5年相对生存率约为40.5%,与10年前相比,我国恶性肿瘤生存率总体提高约10个百分点,但是与发达国家还有很大差距。
二、恶性肿瘤发病与死亡总体情况
据估计,2015年全国新发恶性肿瘤病例数约为392.9万例,其中男性约为215.1万例,女性约为177.8万例,平均每分钟有7.5个人被确诊为癌症。2015年全国恶性肿瘤死亡例数约为233.8万例,其中男性约为148.0万例,女性约为85.8万例。
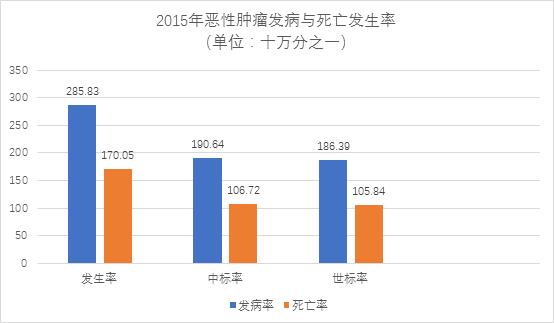
2015年恶性肿瘤发病率为285.83/10万,中标率(中标率:人口标准化率按照2000年中国标准人口结构)为190.64/10万,世标率(世标率:人口标准化率按照Segi's世界标准人口结构)为186.39/10万,累积率(0~74岁)为21.44%。2015年中国恶性肿瘤死亡率为170.05/10万,中标率为106.72/10万,世标率为105.84/10万,累积率(0~74岁)为11.94%。
三、恶性肿瘤的发病与死亡存在地区性差异
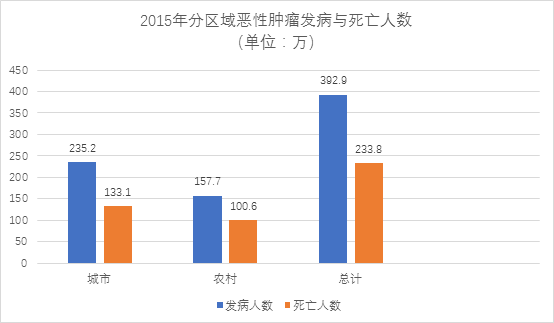
城市地区新发病例数约为235.2万例,占全国新发病例的59.86%。农村地区新发病例数约为157.7万例,占全国新发病例的40.14%。
城市地区恶性肿瘤死亡约为133.1万例,占全国死亡例数的56.93%。农村地区恶性肿瘤死亡约为100.6万例,占全国死亡例数的43.07%。
城市地区恶性肿瘤发病率(304.96/10万)高于农村地区(261.40/10)。城市地区恶性肿瘤死亡率(172.61/10万)高于农村地区(166.79/10万)。
四、恶性肿瘤的发病与死亡存在性别差异
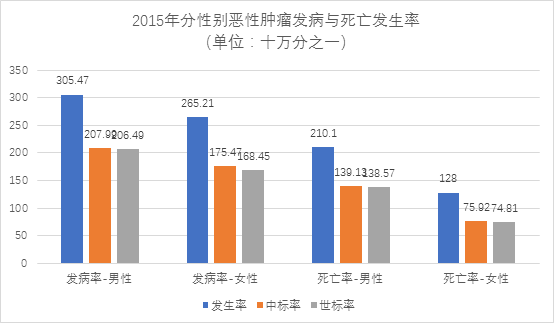
男性恶性肿瘤发病率为305.47/10万,中标率为207.99/10万,世标率为206.49/10万,累积率(0~74岁)为24.36%。女性恶性肿瘤发病率为265.21/10万,中标率为175.47/10万,世标率为168.45/10万,累积率(0-74岁)为18.60%。
男性恶性肿瘤死亡率为210.1/10万,中标率为139.13/10万,世标率为138.57/10万,累积率(0~74岁)为15.79%。女性恶性肿瘤死亡率为128/10万,中标率为75.92/10万,世标率为74.81/10万,累积率(0~74岁)为8.13%。
五、恶性肿瘤的发病与死亡存在年龄差异
恶性肿瘤发病率随年龄增加逐渐上升,到80岁年龄组达到发病高峰,80岁以上年龄组发病率略有下降。其中30岁以前无论城市还是农村地区的恶性肿瘤发病率均相对较低,0-19岁年龄组男性恶性肿瘤发病率略高于女性,20~49岁年龄组女性发病率高于男性,50岁及以上年组男性发病率高于女性。城乡地区人群的年龄别发病率变化趋势相似,男性年龄别发病率的城乡差异不明显,城市地区女性人群的恶性肿瘤发病率略高于农村地区的女性人群。
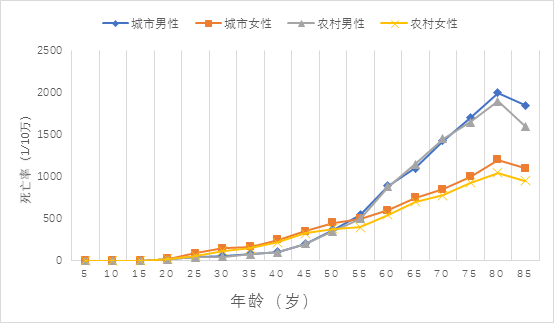
年龄别死亡率变化趋势和发病相似,随年龄增加逐渐上升。男性的年龄别死亡率高于女性。0~39岁人群中,男性年龄別死亡率略高于女性。40岁及以上人群中,同年龄组男性与女性死亡率的差异随年龄的増加而显著增大。城乡人群的年龄别死亡率变化趋势相似。除0~4岁和75岁及以上年龄组农村男性死亡率低于城市男性,其他年龄组农村男性死亡率高于城市男性。20-74岁年龄组农村女性死亡率高于城市女性,其他年龄组城市女性死亡率高于农村女性。
六、主要恶性肿瘤发病情况
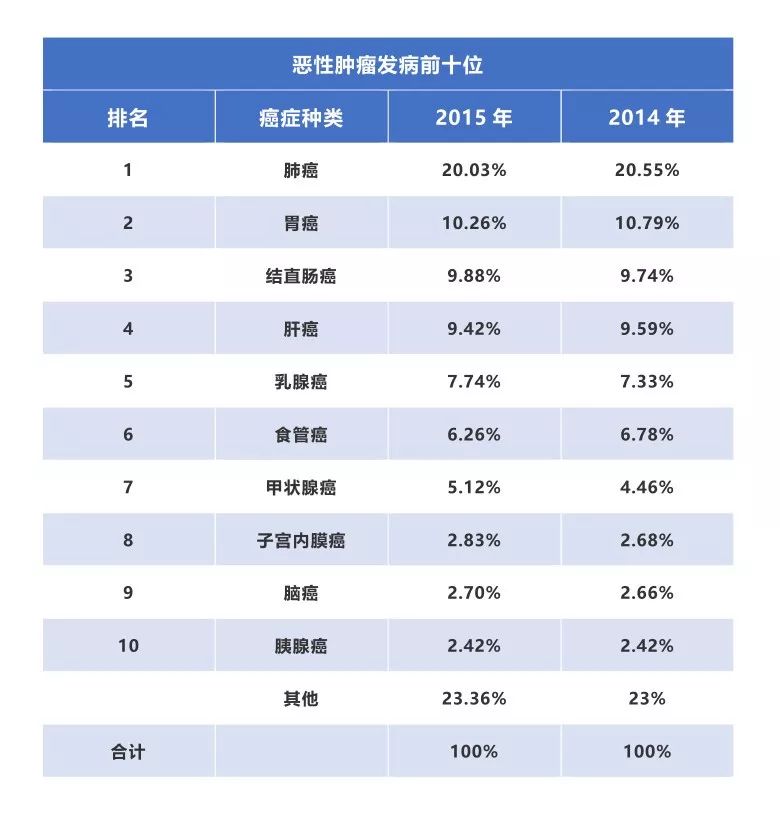
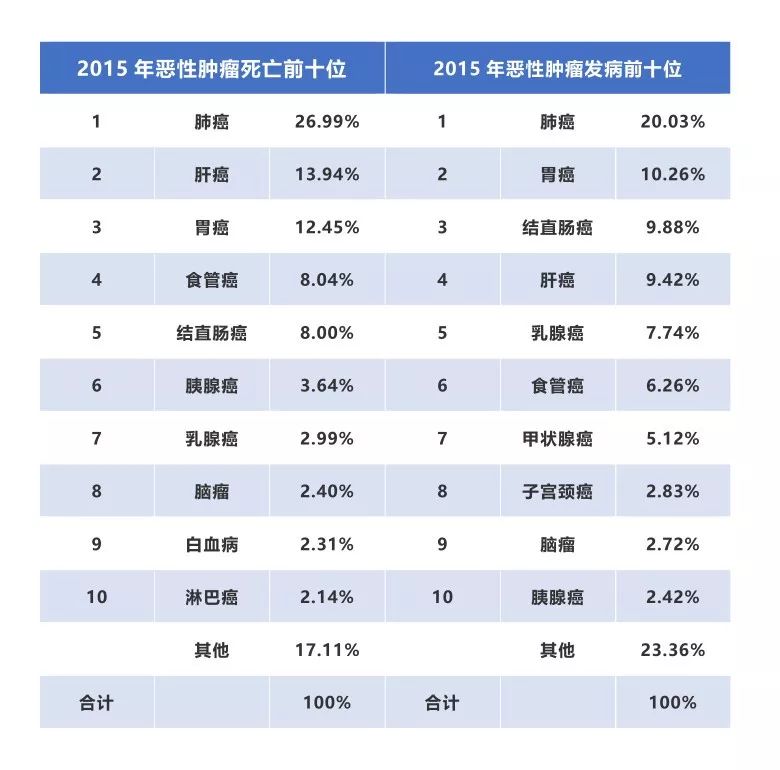
按发病人数顺位排序,肺癌位居我国恶性肿瘤发病首位。估计结果显示,2015年我国新发肺癌病例约为78.7万例,发病率为57.26/10万,中标率为35.96/10万。其他高发恶性肿瘤依次为胃癌、结直肠癌、肝癌和乳腺癌等,前10位恶性肿瘤发病约占全部恶性肿瘤发病的76.70%。与2014年相比,各类高发癌症的顺位完全相同,占比变化不大,甲状腺癌上升相对明显。
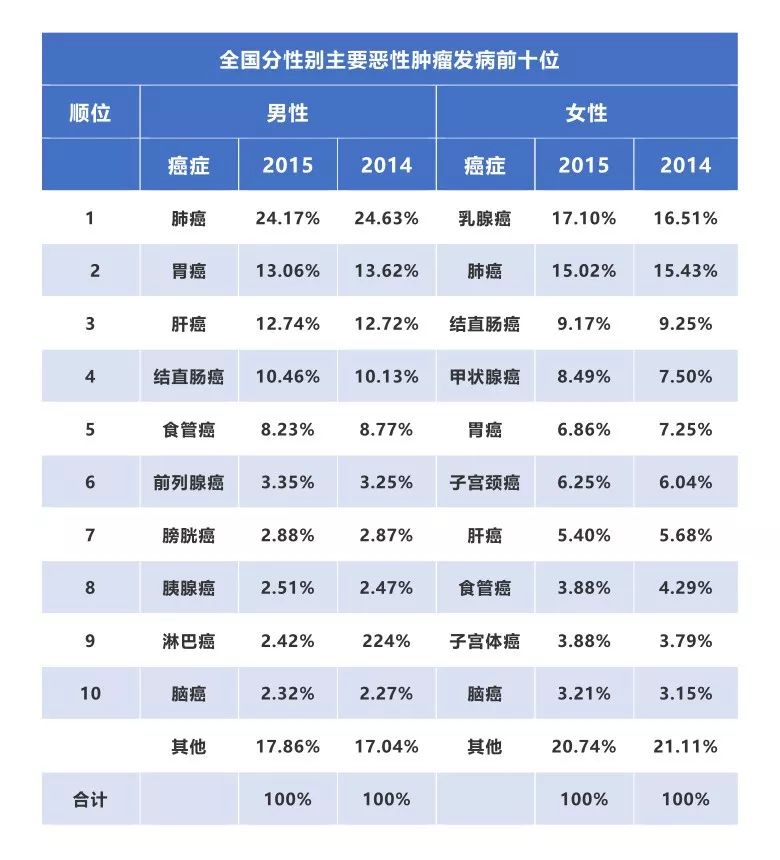
男性发病首位为肺癌,每年新发病例约52.0万,其他高发恶性肿瘤依次为胃癌、肝癌、结直肠癌和食管癌等,前10位恶性肿瘤发病约占男性全部恶性肿瘤发病的82.20%。
女性发病首位为乳腺癌,每年发病约为30.4万,其他主要高发恶性肿瘤依次为肺癌、结直肠癌、甲状腺癌和胃癌等,女性前10位恶性肿瘤发病约占女性全部恶性肿瘤发病的79.10%。
城市地区与农村地区的恶性肿瘤发病顺位有所不同,城市地区主要高发恶性肿瘤依次为肺癌、结直肠癌、乳腺癌、胃癌和肝癌等,农村地区主要高发恶性肿瘤依次为肺癌、胃癌、肝癌、食管癌和结直肠癌等。城市地区与农村地区前10位恶性肿瘤发病分别占城乡全部恶性肿瘤发病的74.80%和79.50%。
七、主要恶性肿瘤死亡情况
按死亡人数顺位排序肺癌位居我国恶性肿瘤死亡第1位,2015年我国因肺癌死亡人数约为63.1万例,死亡率为45.87/10万,中标率为28.16/10万。其他主要恶性肿瘤死亡顺位依次为肝癌、胃癌、食管癌和结直肠癌等,前10位恶性肿瘤死亡约占全部恶性肿瘤死亡的83.00%。死亡排名前十的疾病与发病率排名前十名的疾病存在较为明显的差异,这是由于不同癌症的生存率概率存在明显差异的问题,例如甲状腺癌发病率排名前十,但是死亡率相对较低。
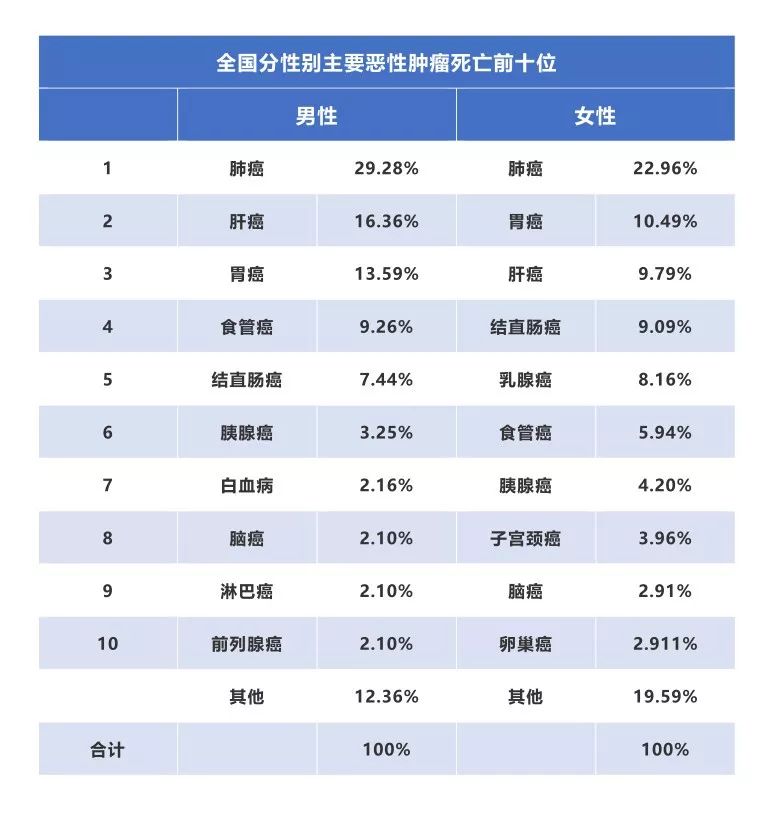
男性和女性的恶性肿瘤死因顺位略有差异。男性依次为肺癌、肝癌、胃癌、食管癌和结直肠癌等,男性前10位恶性肿瘤死亡约占男性全部恶性肿瘤死亡的87.60%。女性主要恶性肿瘤死因顺位依次为肺癌、胃癌、肝癌、结直肠癌和乳腺癌,女性前10位恶性肿瘤死亡约占女性全部恶性肿瘤死亡的80.50%。
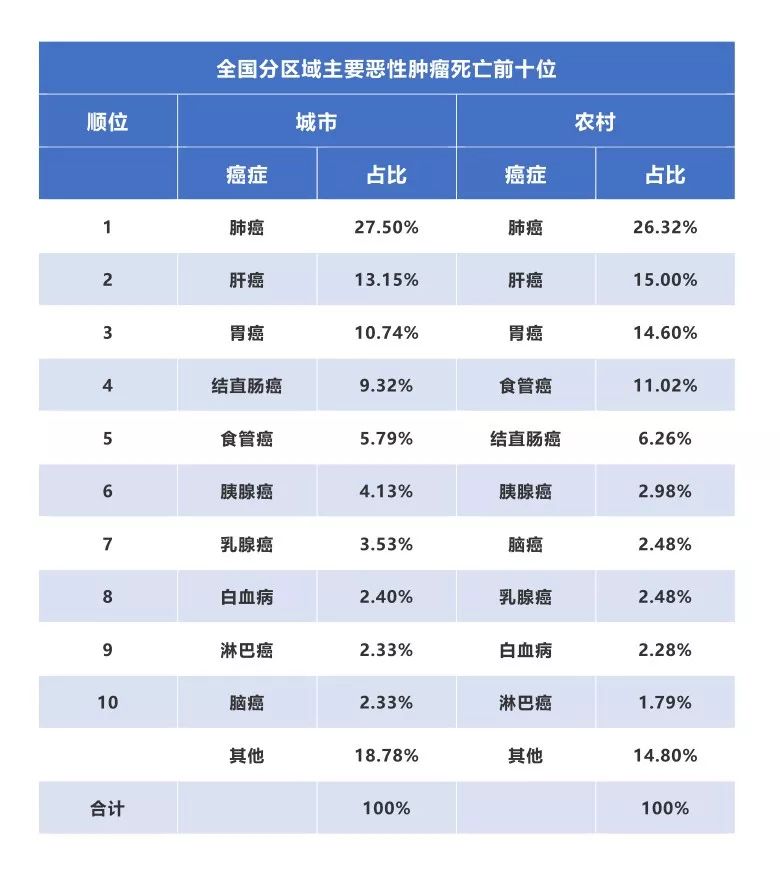
城市地区与农村地区的恶性肿瘤死因顺位不同,城市地区主要恶性肿瘤死因依次为肺癌、肝癌、胃癌、结直肠癌和食管癌,农村地区主要恶性肿瘤死因依次为肺癌、肝癌、胃癌、食管瘤和结直肠癌,城市地区与农村地区前10位恶性肿瘤死亡分别占城乡全部恶性肿瘤死亡的81.30%和85.20%。
恶性肿瘤是严重威胁我国居民健康的一大类疾病。随着我国人口老龄化逐渐加剧、工业化和城镇化进程的不断加快,与慢性感染、不健康生活方式、环境等危险因素的累加,防控形势严峻。
我国目前每年恶性肿瘤发病约392.9万人,死亡约233.8万人,与历史数据相比,癌症负担呈持续上升态势。且近10多年来,恶性肿瘤发病率每年保持约3.9%的增幅,死亡率每年保持2.5%的增幅。农村地区主要癌种以上消化系统肿瘤如食管癌、胃癌、肝癌等预后较差的恶性肿瘤为主,城市地区则以结直肠癌和乳腺癌等恶性肿瘤高发。
目前,我国恶性肿瘤发病、死亡数持续上升,每年恶性肿瘤所致的医疗花费超过2200亿。城乡分析结果显示,城市地区的发病率略高于农村,而死亡率农村略高于城市,但城乡恶性肿瘤发病与死亡的差异逐渐减小,可能是由于恶性肿瘤危险因素的城乡差异在缩小,如吸烟、慢性感染、饮食习惯以及空气污染等,导致发病率日趋接近。而农村医疗资源的相对匮乏,防癌意识相对薄弱,导致农村恶性肿瘤死亡率仍偏高。
在过去的10余年里,恶性肿瘤生存率呈现逐渐上升趋势,目前我国恶性肿瘤的5年相对生存率约为40.5%,与10年前相比,我国恶性肿瘤生存率总体提高约10个百分点,但是与发达国家还有很大差距,其主要原因是我国癌谱和发达国家癌谱存在差异,我国预后较差的消化系统肿瘤如肝瘤胃癌和食管癌等高发,而欧美发达国家则是以甲状腺癌、乳腺癌和前列腺癌等预后较好的肿瘤高发。但必须看到,中国预后较好的肿瘤如乳腺癌(82.0%)、甲状腺癌(84.3%)和前列腺癌(66.4%)的5年生存率仍与美国等发达国家存在差距(90.9%、98%和99.5%)到。
出现这种差距的主要原因是临床就诊早期病例少、早诊率低以及晚期病例临床诊治不规范。因此,我国应在扩大相关肿瘤的筛查及早诊早治覆盖面、肿瘤临床诊治规范化和同质化推广应用两方面共同发力,降低我国恶性肿瘤死亡率。
总之,我国恶性肿瘤负担日益加重,城乡差异较大,地区分布不均衡,癌症防控形势严峻;发达国家和发展中国家癌谱并存,防治难度巨大。
Global, Regional, and National Cancer Incidence,
Mortality, Years of Life Lost, Years Lived With Disability,
and Disability-Adjusted Life-Years for 29 Cancer Groups,
1990 to 2017
A Systematic Analysis for the Global Burden of Disease Study
1990年至2017年全球29个癌症组的癌症发病率,死亡率,丧失生命的年限,残障生命年和经残疾调整后的生命年
对全球疾病负担研究的系统分析
中国十大癌症排行榜
2017年,中国发病率排在前10位的癌症分别为:TBL癌、胃癌、肝癌、结直肠癌、乳腺癌、非黑色素瘤皮肤癌、食管癌、其他恶性肿瘤、前列腺癌、脑和中枢神经系统癌症,如图所示。
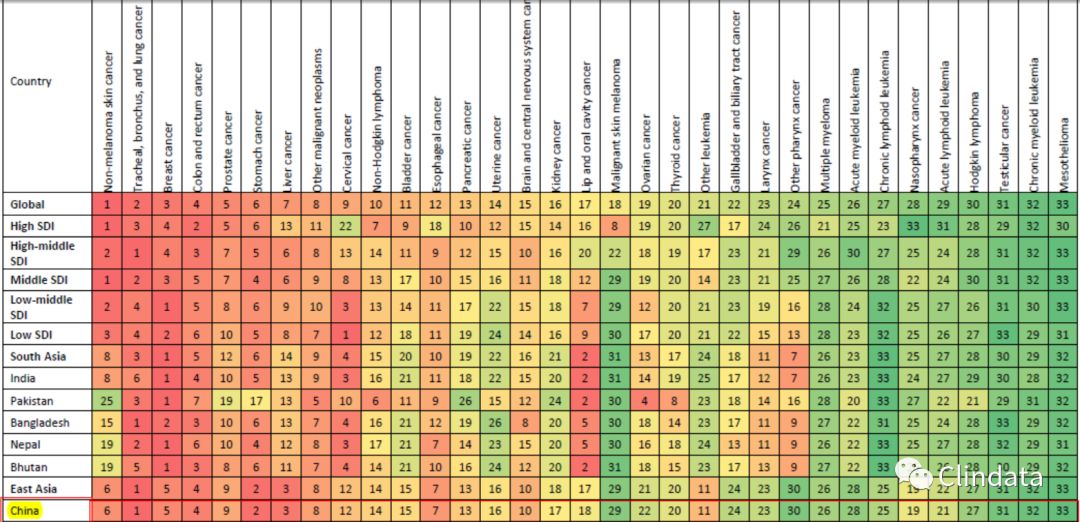
图:2017年中国发病率前十位的癌症
死亡率排在前10位的癌症分别为:TBL癌、肝癌、胃癌、食管癌、结直肠癌、乳腺癌、胰腺癌、其他恶性肿瘤、脑和中枢神经系统癌症和前列腺癌。
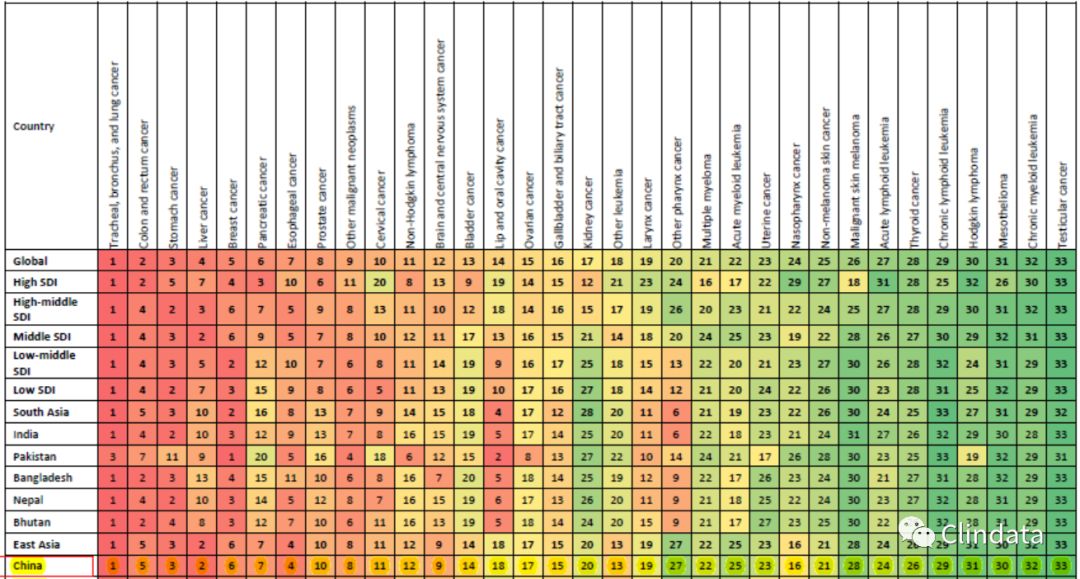
图:2017年中国死亡率前十位的癌症
IMPORTANCE
Cancer and other noncommunicable diseases (NCDs) are now widely recognized as a threat to global development. The latest United Nations high-level meeting on NCDs reaffirmed this observation and also highlighted the slow progress in meeting the 2011 Political Declaration on the Prevention and Control of Noncommunicable Diseases and the third Sustainable Development Goal. Lack of situational analyses, priority setting, and budgeting have been identified as major obstacles in achieving these goals. All of these have in common that they require information on the local cancer epidemiology. The Global Burden of Disease (GBD) study is uniquely poised to provide these crucial data.
OBJECTIVE
To describe cancer burden for 29 cancer groups in 195 countries from 1990 through 2017 to provide data needed for cancer control planning.
EVIDENCE REVIEW
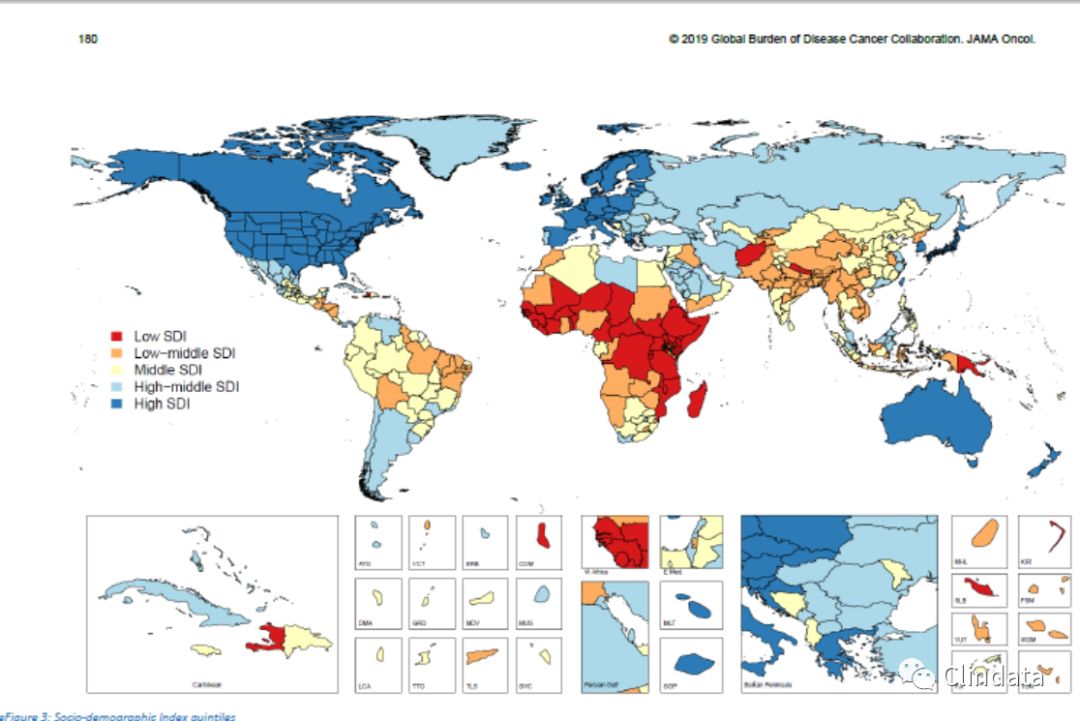
We used the GBD study estimation methods to describe cancer incidence,mortality, years lived with disability, years of life lost, and disability-adjusted life-years (DALYs). Results are presented at the national level as well as by Socio-demographic Index (SDI), a composite indicator of income, educational attainment, and total fertility rate.We also analyzed the influence of the epidemiological vs the demographic transition on cancer incidence.
FINDINGS
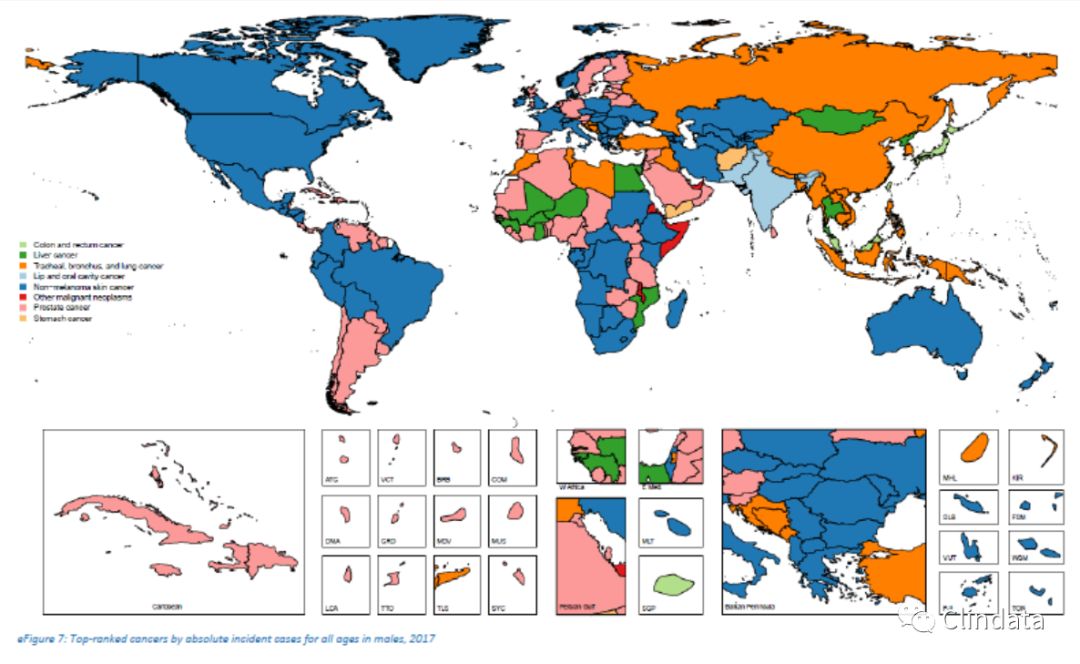
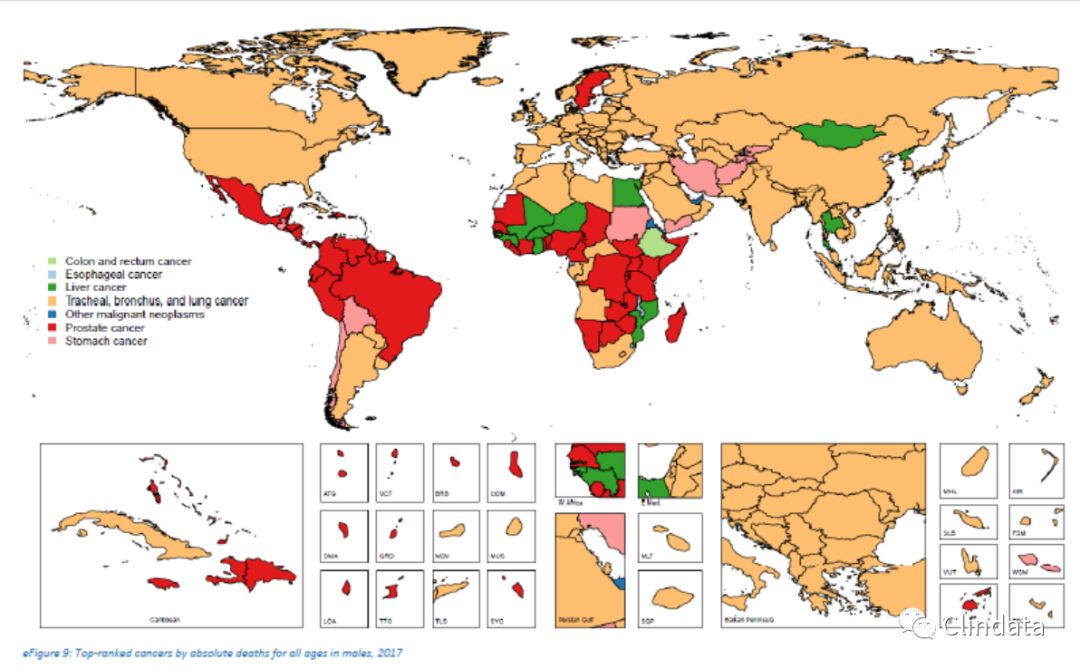
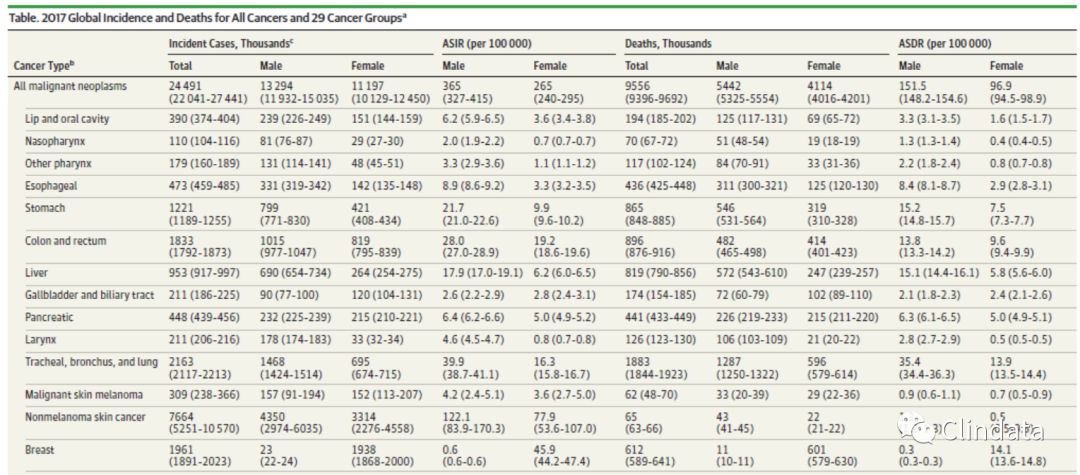
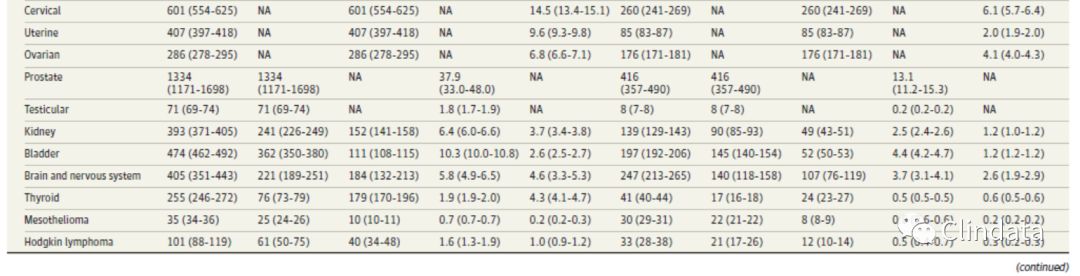
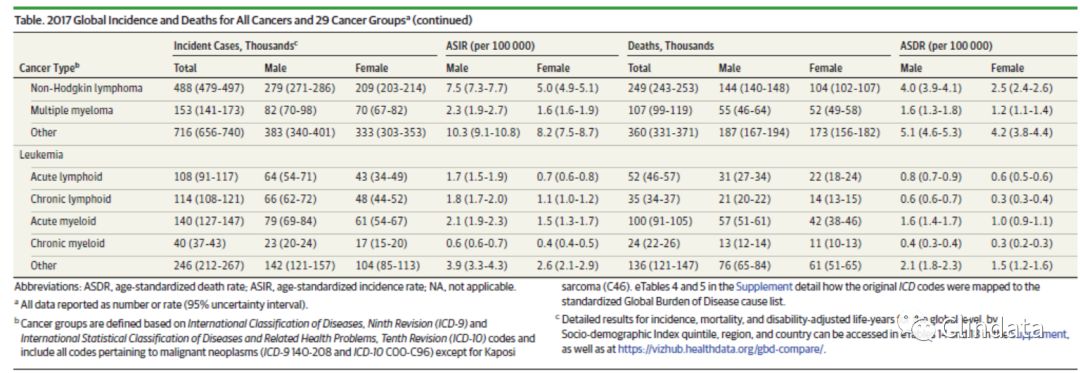
In 2017, there were 24.5 million incident cancer cases worldwide (16.8 million without nonmelanoma skin cancer [NMSC]) and 9.6 million cancer deaths. The majority ofcancer DALYs came from years of life lost (97%), and only 3%came from years lived with disability. The odds of developing cancer were the lowest in the low SDI quintile (1 in 7) and the highest in the high SDI quintile (1 in 2) for both sexes. In 2017, the most common incident cancers in men were NMSC (4.3 million incident cases); tracheal, bronchus, and lung (TBL) cancer (1.5 million incident cases); and prostate cancer (1.3 million incident cases). The most common causes of cancer deaths and DALYs for men were TBL cancer (1.3 million deaths and 28.4 million DALYs), liver cancer (572 000 deaths and 15.2 million DALYs), and stomach
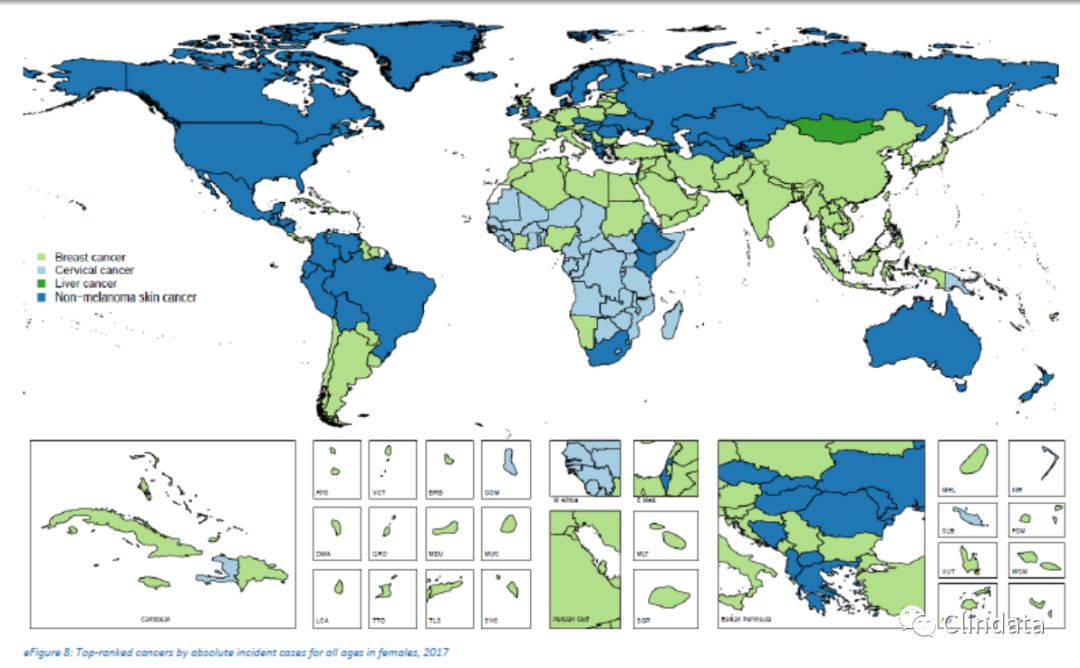
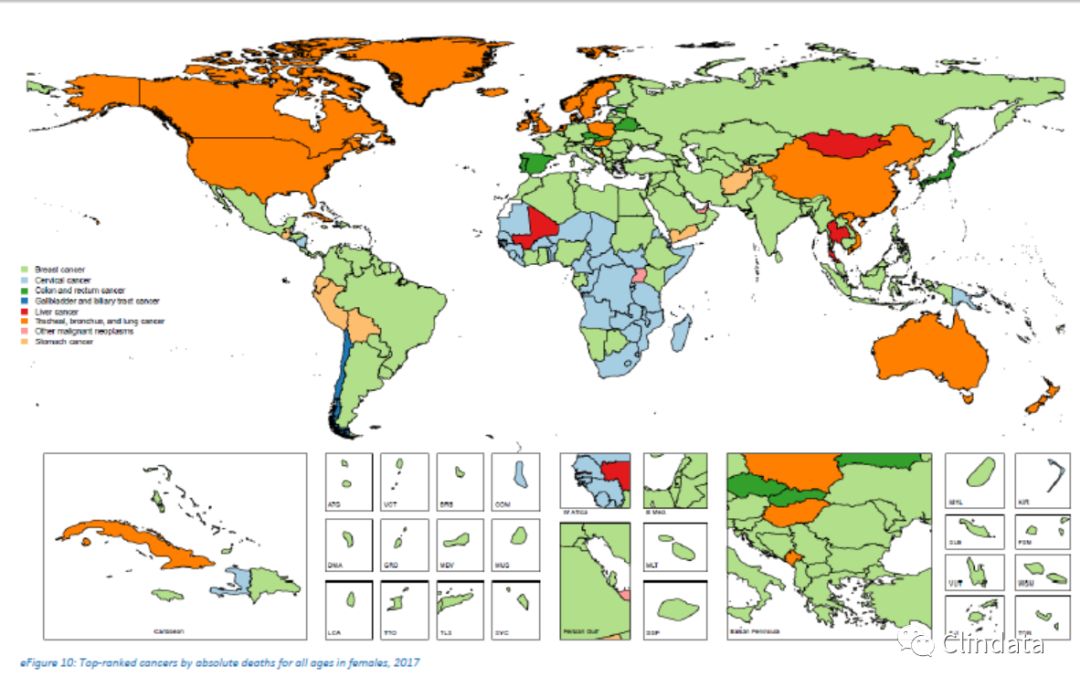
cancer (542 000 deaths and 12.2 million DALYs). For women in 2017, the most common incident cancers were NMSC (3.3 million incident cases), breast cancer (1.9 million incident cases), and colorectal cancer (819 000 incident cases). The leading causes of cancer deaths and DALYs for women were breast cancer (601 000 deaths and 17.4 million DALYs), TBL cancer (596 000 deaths and 12.6 million DALYs), and colorectal cancer (414 000 deaths and 8.3 million DALYs).
CONCLUSIONS AND RELEVANCE
The national epidemiological profiles of cancer burden in the
GBD study show large heterogeneities, which are a reflection of different exposures to risk factors, economic settings, lifestyles, and access to care and screening. The GBD study can be used by policy makers and other stakeholders to develop and improve national and local cancer control in order to achieve the global targets and improve equity in cancer care.
重要性
癌症和其他非传染性疾病(NCD)现在被广泛认为是对全球发展的威胁。联合国非传染性疾病最新高级别会议重申了这一观点,并强调了在实现2011年《关于预防和控制非传染性疾病的政治宣言》和第三个可持续发展目标方面进展缓慢。缺乏情况分析,确定优先重点和预算是实现这些目标的主要障碍。所有这些共同点在于,它们需要有关当地癌症流行病学的信息。全球疾病负担(GBD)研究具有独特的优势,可以提供这些关键数据。
目的
描述1990年至2017年间195个国家的29个癌症组的癌症负担,以提供癌症控制规划所需的数据。
证据审查
我们使用GBD研究估算方法来描述癌症发生率,死亡率,残障生存年限,生命损失年限以及残障调整生命年(DALYs)。结果在国家一级以及社会人口统计学指数(SDI)上进行显示,该指标是收入,教育程度和总生育率的综合指标。我们还分析了流行病学与人口学转变对癌症发病率的影响。
发现
2017年,全球有2450万例癌症事件(1680万例无非黑色素瘤皮肤癌[NMSC])和960万例癌症死亡。大多数癌症DALY来自失去生命的岁月(97%),只有3%来自患有残疾的岁月。男女患低SDI的几率最低(七分之一),高SDI的几率最高(二分之一)。2017年,男性最常见的事件癌症是NMSC(430万起事件);气管,支气管和肺癌(TBL)(150万起事故);和前列腺癌(130万起事件)。男性最常见的癌症死亡和DALY原因是TBL癌(130万死亡和2840万DALY),肝癌(572 000死亡和1520万DALY)和胃癌癌症(542 000例死亡和1220万DALYs)。对于2017年的女性而言,最常见的事件癌症是NMSC(330万事件),乳腺癌(190万事件)和大肠癌(819 000事件)。女性癌症死亡和DALY的主要原因是乳腺癌(601 000例死亡和1740万DALYs),TBL癌(596 000例死亡和1260万DALYs)和结直肠癌(414 000例死亡和830DALYs)。
结论与关联
全国癌症流行病学概况
GBD研究显示出巨大的异质性,这反映了不同的风险因素,经济环境,生活方式以及获得医疗和筛查的机会。政策制定者和其他利益相关者可以使用GBD研究来制定和改善国家和地方癌症控制,以实现全球目标并提高癌症治疗的公平性。Cancer is nowwidely recognized as a global problem that unfortunately lacks a global solution. The latest United Nations high-level meeting on noncommunicable diseases (NCDs) exemplified this conundrum. Despite global commitment to reducing the risk of and disability from NCDs,including cancer, implementation of knownsolutions is inadequate to reach the 2011 Political Declaration on the Prevention and Control of Noncommunicable Diseases(25% reduction in premature mortality from NCDs by 2025) and the third Sustainable Development Goal (by 2030 reduce by onethird premature mortality from NCDs through prevention and treatment, and promote mental health and well-being).To reduce cancer burden, identifying the scope of the problem and mapping out implementation of solutions is best done in National Cancer Control Plans (NCCPs). However, a recent review showed that only 29% of low-income countries had a NCCP, and even if NCCPs existed, cost, financing, monitoring,and expansion of information systems was often inadequate.Many highly effective prevention and treatment strategies exist for cancer.However, they are often very specific (eg,vaccination forhumanpapillomavirus and hepatitisBvirus for prevention of cervical and liver cancer, or tyrosine kinase inhibitors for cancerswith targetablemutations). Effective NCCPs therefore require detailed knowledge about the local burden of cancer and associated risk factors. We herein present results from the Global Burden of Disease (GBD) 2017 study describing cancer incidence, mortality, years of life lost (YLLs), years livedwith disability (YLDs), and disability-adjusted lifeyears (DALYs) for 195 countries from1990 through 2017, which can inform cancer control through policy, resource allocation,and health system planning.癌症已被广泛认为是一个全球性问题,但不幸的是缺乏全球性解决方案。最近的联合国非传染性疾病高级别会议就是这一难题的例证。尽管全球致力于降低包括癌症在内的非传染性疾病的风险和致残性,但已知解决方案的实施仍不足以达成2011年《关于预防和控制非传染性疾病的政治宣言》(到2025年使非传染性疾病的过早死亡减少25%)和第三次可持续发展。发展目标(到2030年,通过预防和治疗将非传染性疾病的过早死亡率降低三分之一,并促进心理健康和福祉)。减少癌症负担,确定问题的范围并规划解决方案的实施最好在国家癌症中心控制计划(NCCP)。然而,最近的一项审查表明,只有29%的低收入国家拥有NCCP,即使存在NCCP,信息系统的成本,融资,监控和扩展也常常不足。许多有效的癌症预防和治疗策略存在但是,它们通常非常具体(例如,人乳头瘤病毒和乙型肝炎病毒的疫苗接种,以预防子宫颈癌和肝癌,或酪氨酸激酶抑制剂用于具有可靶向突变的癌症)。因此,有效的NCCP需要有关癌症局部负担和相关风险因素的详细知识。我们在此提供了2017年全球疾病负担(GBD)研究的结果,该研究描述了1990年至2017年间195个国家的癌症发病率,死亡率,生命损失年限(YLLs),残疾寿命年限(YLDs)和残疾调整生命年(DALYs)。可以通过政策,资源分配和卫生系统规划来告知癌症控制。Methods
Methods have remained similar to the GBD 2016 study.Detailed descriptions of the methods can be found in theGBD 2017 publications as well as in the eAppendix, eFigures, and eTables in the Supplement.For eachGBDstudy, the entire time series is re-estimated. This study therefore supersedes prior GBD iterations. The GBD study is compliant with the Guidelines forAccurate and TransparentHealth EstimatesReporting statement (eTable 1 in the Supplement). Compared with the prior GBD study (GBD 2016), the neoplasms category for GBD 2017 also includes benign and in situ neoplasms (International Statistical Classification of Diseases and Related Health Problems, Tenth Revision [ICD-10] codes D00-D49). Because
disability associatedwithbenign neoplasms is most often very small,we only estimated disability for the new cause:myelodysplastic,
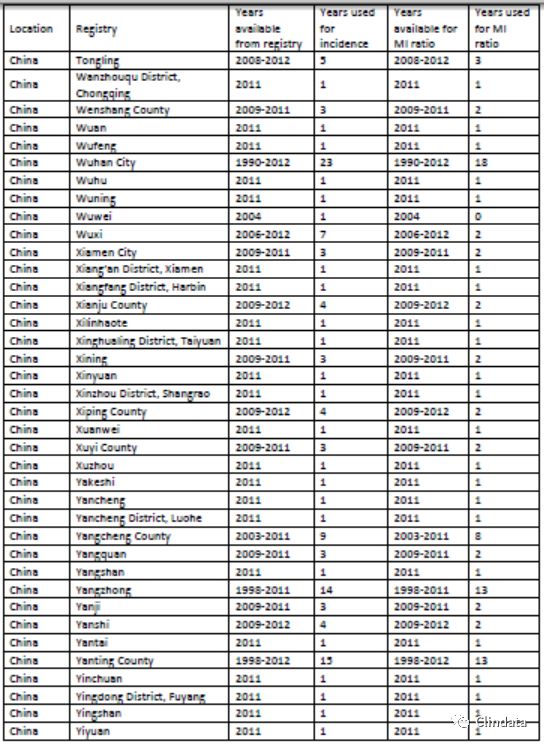
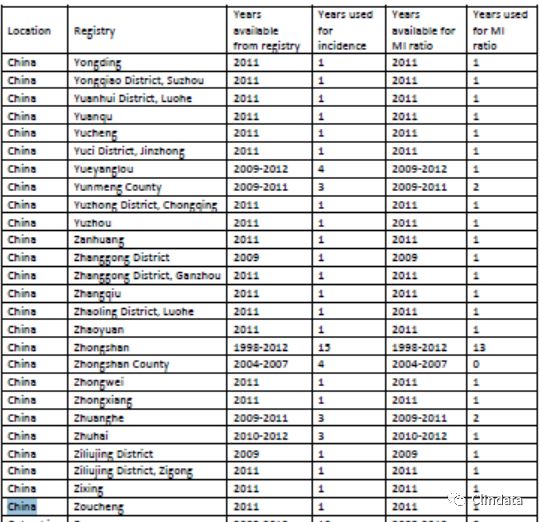
myeloproliferative, and other hematopoietic neoplasms.The terms malignant neoplasms or cancer in this article only include ICD-10 codes C00 through C96. Other changes since GBD 2016 are the addition of new data sources(eTable 3 in the Supplement) for GBD 2017 and improvements in the way we estimated cancer survival by using the mortality-to-incidence ratio (MIR). In this study, estimates are presented for 29 cancer categories and 195 countries and territories.Estimates for benign neoplasms as well as selected subnational estimates are available online (https://vizhub.
healthdata.org/gbd-compare/ andhttp://ghdx.healthdata.org/
gbd-results-tool). All rates are reported per 100000 personyears.
The GBD world population standard was used for the calculation of age-standardized rates.9 We report 95% uncertainty intervals for all estimates.方法
方法仍与GBD 2016研究相似,有关方法的详细说明可在GBD 2017出版物以及增刊中的eAppendix,eFigures和eTables中找到。对于每个GBD研究,将重新估算整个时间序列。因此,本研究取代了先前的GBD迭代。GBD研究符合《准确和透明的健康估计报告指南》声明(补编中的表1)。与之前的GBD研究(GBD 2016)相比,GBD 2017的肿瘤类别还包括良性和原位肿瘤(《国际疾病和相关健康问题统计分类》,第十次修订[ICD-10]代码D00-D49)。因为与良性肿瘤相关的残疾通常很小,我们仅估计新病因的残疾:骨髓增生异常,骨髓增生性和其他造血肿瘤。本文中的术语“恶性肿瘤或癌症”仅包括ICD-10代码C00至C96。自GBD 2016以来的其他变化是为GBD 2017添加了新的数据源(补编中的表3),并通过使用死亡率与发病率(MIR)来估计癌症存活率的方式有所改进。在这项研究中,给出了针对195个国家和地区的29种癌症类别的估计值,有关良性肿瘤的估计值以及部分国家以下估计值可在线获得(https:// vizhub.healthdata.org/gbd-compare/和http://ghdx.healthdata.org/gbd-results-tool)。所有费率均按每100000人年报告。GBD世界人口标准用于计算年龄标准化率。9我们报告所有估计的不确定性区间为95%。
Estimation Framework
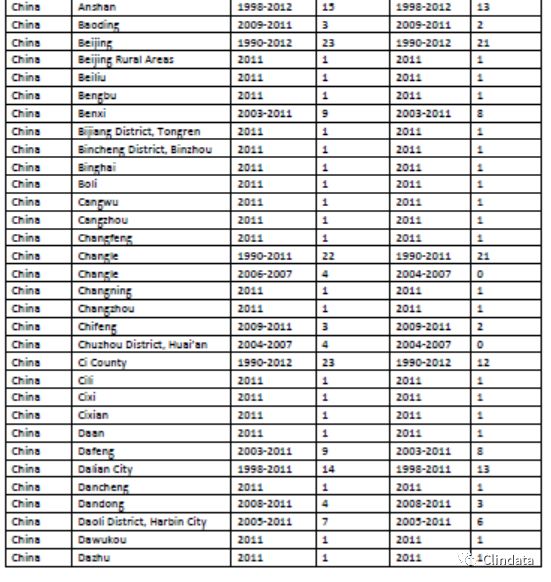
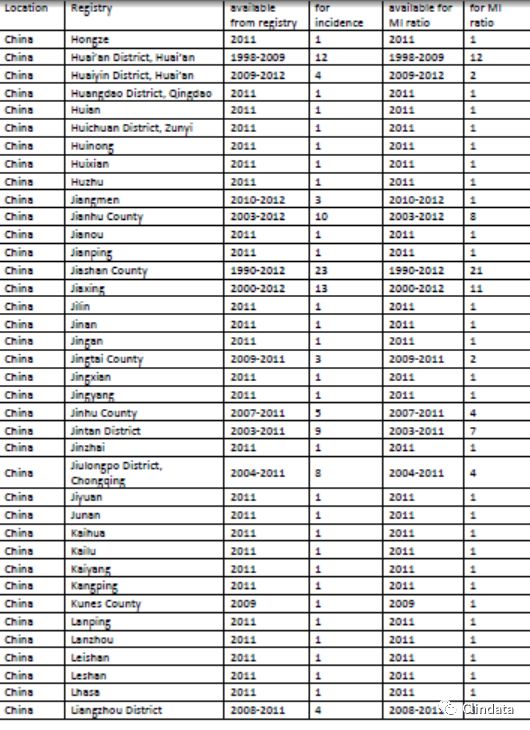
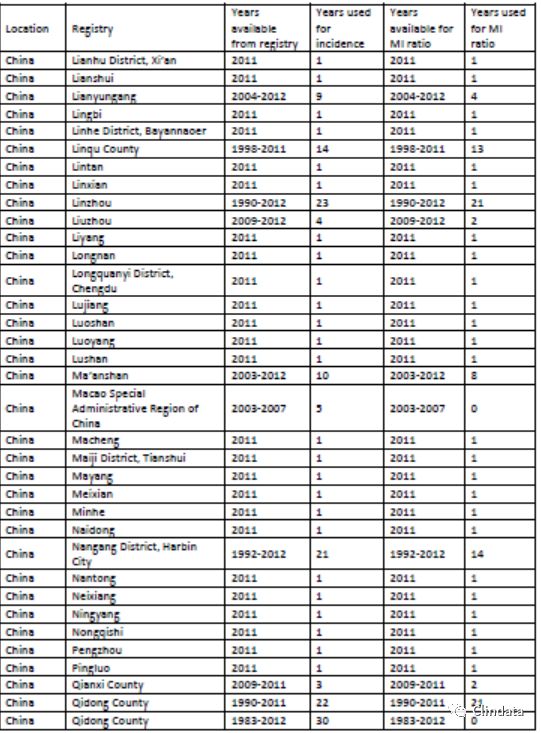
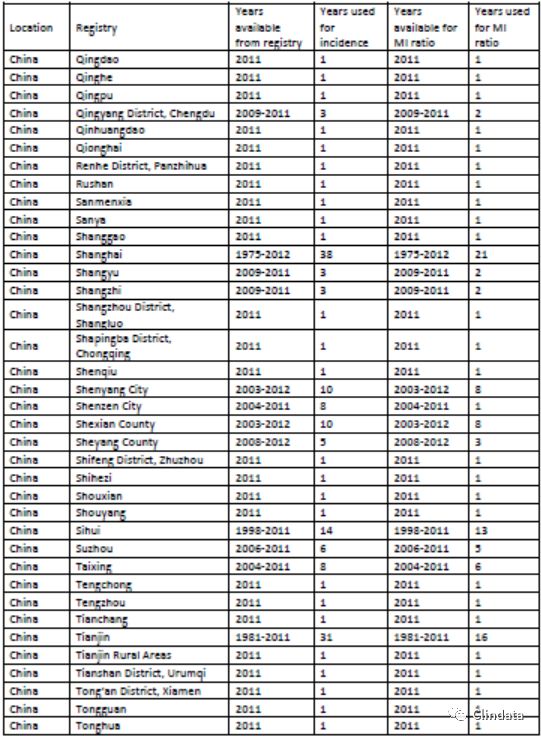
The GBD cancer estimation process starts with mortality.Mortality estimates are made based on vital registration system(83% of data), cancer registry (16% of data) (eTable 3 in the Supplement), and verbal autopsy data (1% of data) using an ensemble model approach.9,10 Predictive covariates used in the model can be found in the eAppendix (eTable 8 in the Supplement). Single-cause mortality estimates are scaled into the separately estimated all-cause estimate.9 To estimate cancer incidence, mortality estimates are divided by a separately estimated MIR for each cancer type, sex, 5-year age group, location, and year; additional information regarding incidence and MIR estimation can be found in the eAppendix and eFigure2 inthe Supplement.Data sources used for estimatingMIRs
are described in eTable 2 in the Supplement. MIRs allowfor a uniform method to estimate incidence. Other cancer estimation frameworks11,12 have set a precedent for using MIRs for decades and have detailed its benefits, including greater representativeness,
especially in settings that lack quality or complete population-based cancer registry systems. By determining incidence using mortality, we are able to account for uncaptured incident cases and, if mortality and incidence are determined correctly, estimating incidence based on MIRs should result in the similar results if using incidence directly.
The correlation between survival data and the MIR is used to estimate 10-year cancer prevalence. Total prevalence is partitioned
into 4 sequelae: (1) diagnosis/treatment, (2) remission,(3) metastatic/disseminated, and (4) terminal phase.Each sequela prevalence is multiplied by a disability weight to estimate YLDs. Lifetime prevalence of procedure-related disability is estimated for larynx, breast, colorectal, bladder, and prostate cancers. A standard life expectancy is used to estimate years of life lost (YLLs).9 DALYs are the sum of YLDs and YLLs. To determine the contribution of population aging,population growth, and change in age-specific rates on the change in incident cases between 2007 and 2017, we use
hypothetical demographic scenarios holding 2 of these 3 components
constant. Results are stratified by quintiles of Sociodemographic
Index (SDI), which is a composite indicator including fertility, education, and income.
估算框架
GBD癌症评估过程始于死亡率,死亡率评估是基于生命登记系统(数据的83%),癌症登记(数据的16%)(补编中的表3)和口头尸检数据(数据的1%)进行的。9,10该模型中使用的预测协变量可以在eAppendix中找到(补编中的eTable 8)。单因死亡率估算被缩放为单独估算的全因估算。9为了估算癌症发生率,将死亡率估算除以每种癌症类型,性别,5岁年龄组,位置和年份的单独估算的MIR;有关发病率和MIR估计的其他信息,请参见附录中的eAppendix和eFigure2。用于估计MIR的数据源附录中的eTable 2中对此进行了说明。MIR允许使用统一的方法来估计发生率。其他癌症评估框架[11,12]为使用MIR提供了数十年的先例,并详细说明了其好处,包括提高代表性,特别是在缺乏质量或缺乏完整的基于人群的癌症登记系统的环境中。通过使用死亡率确定发病率,我们可以考虑未捕获的事件病例,如果正确确定了死亡率和发病率,那么如果直接使用发病率,则基于MIR估算发病率应该会得出相似的结果。生存数据与MIR之间的相关性用于估计10年癌症患病率。总患病率划分分为4个后遗症:(1)诊断/治疗,(2)缓解,(3)转移/扩散和(4)末期。每个后遗症患病率乘以残疾权重以估算YLD。估计与手术相关的残疾的终生流行率适用于喉癌,乳腺癌,结直肠癌,膀胱癌和前列腺癌。使用标准预期寿命来估计丧失的年限(YLL)。9DALY是YLD和YLL的总和。为了确定2007年至2017年间人口老龄化,人口增长以及特定年龄比率的变化对突发事件变化的影响,我们使用假设的人口统计情景,包含这三个组成部分中的两个不变。结果按社会人口统计学的五分位数分层指数(SDI),是包括生育率,教育程度和收入的综合指标。Results
Global Incidence, Mortality, and DALYs In 2017, there were 24.5 million (95% UI, 22.0-27.4 million)incident cancer cases worldwide and 9.6 million (95% UI,9.4-9.7 million) cancer deaths (Table). Cancer caused 233.5 million (95% UI, 228.8-238.0 million) DALYs in 2017, of
which 97% came from YLLs and 3% came from YLDs (eTable 15 and eFigure 4 in the Supplement). Globally, the odds of developing cancer during a lifetime (ages 0-79 years) were 1 in 3 for men and 1 in 4 for women (eTable 16 in the Supplement). These odds differ substantially among SDI quintiles, ranging from 1 in 7 at the lowest SDI quintile to 1 in 2 at the highest SDI quintile for both sexes. In 2017, skin; tracheal,bronchus, and lung (TBL); and prostate cancers were the most common incident cancers in men, accounting for
54% of all cancer cases. The most common causes of cancer
deaths and DALYs for men were TBL, liver, and stomach cancers
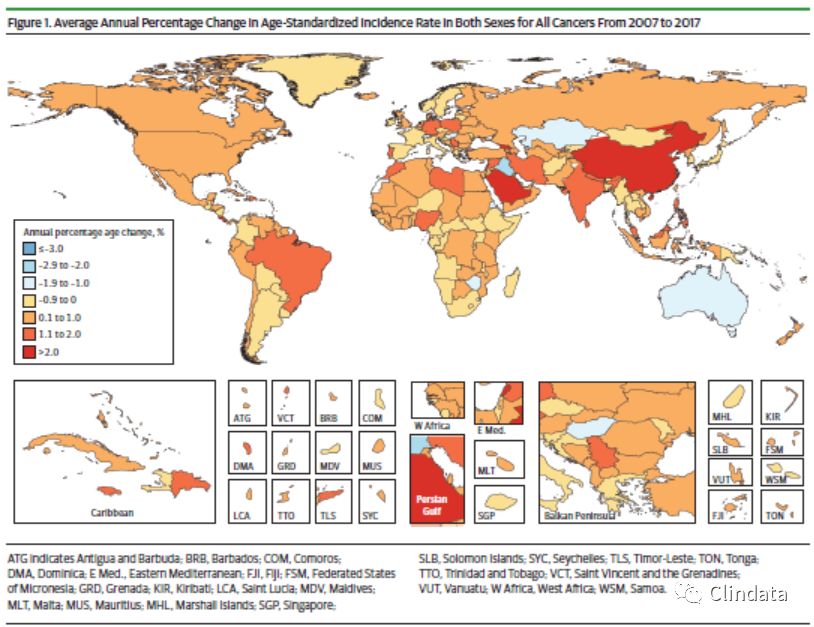
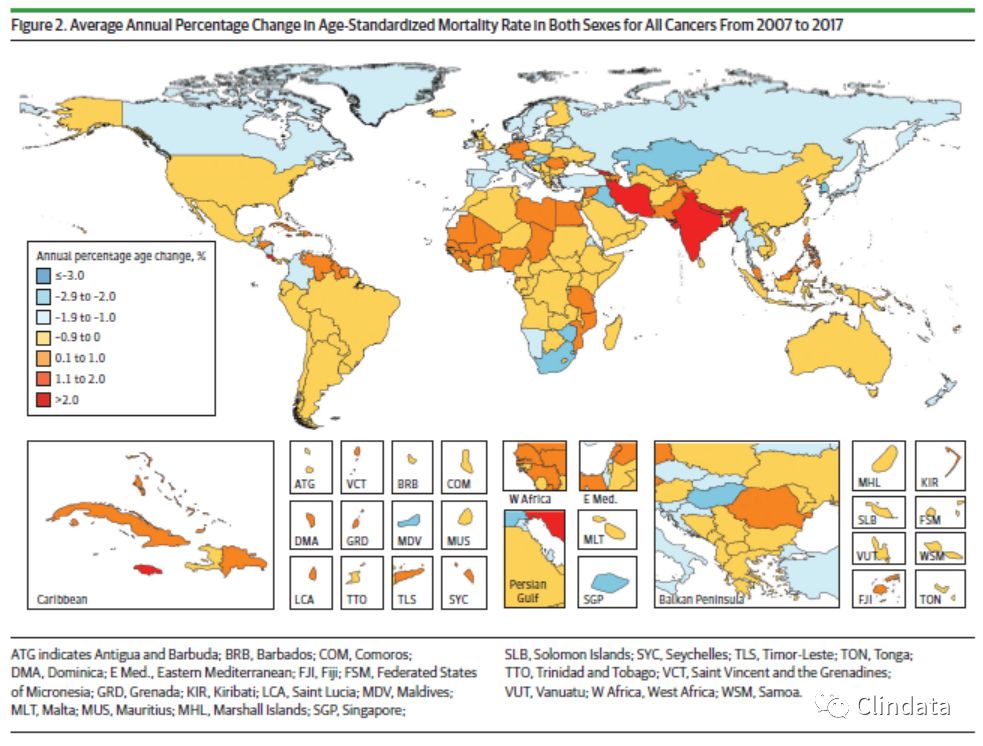
(Table). For women in 2017, the most common incident cancers were nonmelanoma skin cancer (NMSC), breast cancer,and colorectal cancer, accounting for 54% of all incident cases. The leading causes of cancer deaths and DALYs for women were breast, TBL, and colorectal cancers. Between 2007 and 2017, the average annual agestandardized incidence rates (ASIRs) for all cancers combined increased in 123 of 195 countries (Figure 1 and eFigure 5
in the Supplement). In contrast, the average annual agestandardized
death rates for all cancers combined decreased within that timeframein 145of 195countries (Figure2andeFigure 6 in the Supplement). Incident cases for both sexes combined increased in all SDI quintiles between 2007 and 2017 for nearly all cancers (eTable 14 in the Supplement). The largest increase in cancer incident cases between 2007 and 2017 occurred in middle SDI countries,with a 52% increase, of which
changing age structure contributed 24%, population growth 10%, and changing age-specific incidence rates 18%. The drivers behind increasing cancer incidence differ substantially by SDI. Whereas in the lowest SDI quintile, population growth is the major contributor to the increase in total cancer incidence,in low-middle SDI countries aging and changes in incidence rates contribute equally (each 12%), and in high middle and high SDI countries, increased incidence is mainly
driven by population aging (eTable 14 in the Supplement).结果
全球发病率,死亡率和DALYs在2017年,全世界有2450万例(95%UI,22.0-2740万)癌症事件和960万例(95%UI,9.4-970万)癌症死亡(表)。2017年,癌症引起了2.335亿(95%UI,2.288-2.380亿)DALYs其中97%来自YLL,3%来自YLD(补编中的表15和图4)。在全球范围内,一生中(0-79岁)罹患癌症的几率是男性中三分之一,女性中四分之一(补编中的表16)。这些几率在SDI五分位数之间存在很大差异,从最低的SDI五分位数的7分之一到最高的SDI五分位数的二分之一。2017年,皮肤;气管,支气管和肺(TBL);前列腺癌是男性中最常见的事件癌症,占所有癌症病例的54%。癌症的最常见原因男性的死亡和DALY为TBL,肝癌和胃癌(表)。对于2017年的女性而言,最常见的事件癌症是非黑素瘤皮肤癌(NMSC),乳腺癌和结直肠癌,占所有事件的54%。女性癌症死亡和DALY的主要原因是乳腺癌,TBL和大肠癌。在2007年至2017年之间,在195个国家中的123个国家,所有癌症的平均年均标准化年龄发生率(ASIR)有所增加(图1和e图5在补编中)。相比之下,年平均年龄标准化在此时间范围内,在195个国家中的145个国家,所有癌症的总死亡率均下降了(图2和图补编中的第6条)。两性事件合计在2007年至2017年之间,所有SDI的五分位数有所增加几乎所有癌症(补编中的表14)。最大的2007年至2017年间发生的癌症事件病例增加在中SDI国家中增长了52%,其中不断变化的年龄结构贡献了24%的人口增长10%,且按年龄段变化的发病率18%。在增加癌症发生率方面驱动因素的主要区别在于SDI。在最低的SDI五分位数中,人口增长为
导致总癌症发生率增加的主要因素,中低等SDI国家的人口老龄化和发病率变化率平均贡献(每个占12%),处于中等偏上和SDI高的国家,发病率上升的主要原因是由人口老龄化驱动(附录中的表14)。Global Top 10 Cancers in 2017
The global top 10 cancerswere ranked by the highest number
of incident cases, excluding “other malignant neoplasms.”1. Nonmelanoma Skin Cancer
In 2017, therewere 7.7 million (95%UI, 5.3-10.6 million) incident cases of NMSC, of which 5.9 million (95%UI, 3.7-8.7 million)were due to basal cell carcinoma and 1.8 million (95%UI,1.1-2.6 million) due to squamous cell carcinoma. There were 65000 (95%UI, 63 000-66000) deaths due to NMSC (Table) and 1.3 million (95%UI, 1.3-1.4 million) DALYs, of which 97% came from YLLs (Figure 3) and 3% from YLDs (eTable 15 and eFigure 4 in the Supplement). Over a lifetime, the odds of developing NMSC were1 in 7 formenand 1 in 10forwomenglobally.
For men, the odds ranged from 1 in 71 in low SDI countries to 1 in 2 in high SDI countries, and for women from 1 in 104 in lowSDIcountries to1 in4inhigh SDIcountries (eTable 16 in the Supplement). An aging and growing population has led to a 33% (95% UI, 29%-36%) increase in NMSC cancer cases,from 5.8 million (95% UI, 4.1-7.8 million) in 2007 to 7.7 million(95%UI, 5.3-10.6 million) in 2017. The majority of this increase(20%) can be attributed to a change in the population
age structure, and 13% can be attributed to population growth
(eTable 14 and eFigure 11 in the Supplement).2017年全球十大癌症
全球十大癌症排名最高不包括“其他恶性肿瘤”。
1.非黑素瘤皮肤癌
2017年,发生770万例(95%UI,5.3-10.60亿)NMSC事件,其中590万例(95%UI,370-870万)是基底细胞癌和180万例(95%UI,1.1%) -260万)归因于鳞状细胞癌。NMSC(表)造成65000(95%UI,63 000-66000)死亡和130万(95%UI,130-140万)DALYs死亡,其中97%来自YLL(图3),3%来自YLD(补编中的表15和表4)。在整个生命周期中,全球范围内发展NMSC的几率是7分之1和10分之。对于男性而言,赔率从低SDI国家的71分之一到高SDI国家的2分之一,而女性的赔率从低SDI国家中的104分之一到高SDI国家的1分之四(见附录中的表16)。人口老龄化和增长导致NMSC癌症病例增加了33%(UI为95%,29%-36%),从2007年的580万(UI为95%,4.1-780万)增加到770万(UI为95%) ,即2017年的530.10百万)。其中大部分增长(20%)可归因于人口变化年龄结构,其中13%可归因于人口增长附录中的表14和图11)。2. Tracheal, Bronchus, and Lung Cancer
In 2017, there were 2.2 million (95% UI, 2.1-2.2 million) incident
cases of TBL cancer and 1.9 million (95% UI, 1.8-1.9 million)
deaths. Tracheal, bronchus, and lung cancer caused 40.9
million (95%UI,40.0-41.9million)DALYs in2017,ofwhich99%
came from YLLs and 1% from YLDs (eTable 15 and eFigure 4
in the Supplement).Menweremore likely to develop TBL cancer
over a lifetime thanwomen (1 in 17 men vs 1 in 43women)
(eTable 16 in the Supplement). The odds were the highest in
high-middle SDI countries for men (1 in 13) and in high SDI
countries for women (1 in 28). In low SDI countries, the odds
were the lowest (1 in 45 for men and 1 in 142 forwomen). Tracheal,
bronchus, and lung cancer was the leading cause of cancer
in high-middle SDI countries (eFigure 5 in the Supplement).
It was the most common cause of cancer deaths by
absolute cases globally, as well as in all SDI quintiles (eFigure
6 in the Supplement). For men, TBL cancer was the most
common incident cancer in 48 countries and the most common
cause for cancer deaths in 110 countries (eFigures 7 and
9 in the Supplement). For women, TBL cancer was the most
common incident cancer in Greenland and the most commoncause
of cancer deaths in 22 countries (eFigures 8 and 10
in the Supplement).Between 2007 and 2017,TBL cancer cases
increased by 37% (95% UI, 33%-40%). Changing age structure
contributed 19%, population growth 13%, and changes in
age-specific incidence rates 5%(eTable 14 and eFigure 11 in the
Supplement). The ASIRs between 1990 and 2017 showdiverging
results between men andwomen globally and in high SDI
countries, with ASIRs decreasing in men but increasing in
women (eFigure 12 in the Supplement). In high-middle SDI
countries, ASIRs remained stable for men but increased for
women, whereas rates increased for both sexes in middle SDI
countries (eFigures 13 and 14 in the Supplement).2.气管,支气管和肺癌
2017年,发生了220万次事件(UI为95%,2.1-220万)TBL癌症和190万例病例(95%UI,1.8-190万)死亡气管,支气管和肺癌引起40.9
2017年有100万(95%UI,40.0-4190万)DALYs,其中99%来自YLL,而1%来自YLD(见表15和e图4在补充中)。男性更有可能发展为TBL癌症超过一生的女性人数(17名男性中的1名vs 43名女性中的1名)
(补编中的表16)。赔率最高SDI中度较高的国家(男性)(13分之一)和SDI较高的国家妇女的国家(28个国家中的1个)。在低SDI国家/地区,赔率最低(男性45分之一,女性142分之一)。气管支气管和肺癌是癌症的主要原因在高中SDI国家(如补编中的图5)。它是导致癌症死亡的最常见原因全球绝对情况以及所有SDI五分位数(eFigure补编中的第6条)。对于男性来说,TBL癌症是最在48个国家中最常见的事件性癌症,最常见110个国家/地区导致癌症死亡的原因(图7和补编中的9)。对于女性来说,TBL癌症是最格陵兰的常见癌症和最常见的原因22个国家/地区的癌症死亡人数(图8和10)在补充资料中).2007年至2017年之间,TBL癌症病例增加了37%(95%用户界面,33%-40%)。不断变化的年龄结构贡献了19%,人口增长了13%,特定年龄段的发病率5%(e表14和e图11补充)。1990年至2017年之间的ASIR呈现出差异全球和高SDI的男女之间的结果国家,男性的ASIR减少,而妇女(补编中的图12)。在高中SDI国家,男子的ASIR保持稳定,但男子的ASIR增加女性,而中度SDI的男女比例均上升国家(如补编中的图13和图14)。3. Breast Cancer
Breast cancerwasthe thirdmostcommonincident canceroverall
with an estimated 2.0 million (95% UI, 1.9-2.0 million)incident cases in 2017. The majority occurred in women (1.9million [95% UI, 1.9 -2.0 million]) (Table). Breast cancer was among the top 3 leading causes of cancer in all SDI quintiles except for the high and high-middle SDI quintiles, where it was the fourth most common cancer (eFigure 5 in the Supplement).It caused 601000 (95% UI, 579 000-630000) deaths
inwomen and 11000 (95%UI, 10 000-11000) deaths in men,making it the fifth leading cause of cancer deaths for both sexes combined in 2017 globally (eFigure 6 in the Supplement). For women, breast cancer was the leading cause of cancer death in 2017 (Table). Breast cancer caused 17.7 million (95%UI, 16.9-18.7 million) DALYs for both sexes, of which 93% came from YLLs and 7%fromYLDs (eTable 15 and eFigure 4 inthe Supplement).Globally, 1 in 18 women developed breast cancer over a lifetime (eTable 16 in the Supplement). Forwomen, the odds of developing breast cancerwere the highest in high SDI countries(1 in 11), and the lowest in lowSDI countries (1 in 38). For women, breast cancer was the most common cancer in 143 countries and the most common cause of cancer deaths in 112 countries (eFigures 8 and 10 in the Supplement). Overall, incident cases increased by 35%(95%UI, 30%-39%) because of a change in the population age structure (contributing 15%),population growth (contributing 13%), and an increase in agespecific incidence rates (contributing 7%) (eFigure 11 in the Supplement). Between 2007 and 2017, ASIRs for women decreased in high SDI countries but increased in the other SDI quintiles (eFigures 12-16 in the Supplement).3.乳腺癌
乳腺癌是第三大常见癌症
在2017年,估计有200万例(95%UI,1.9-2.0百万)事件。大部分发生在女性中(190万例[95%UI,1.9 -2.0百万])(表)。乳腺癌是所有SDI五分位数中癌症的三大主要诱因之一,但高SDI五分位数和中高中五分位数是第四大最常见癌症(补充资料中的图5),它引起了601000(UI为95%, 579 000-630000)死亡女性和11000名男性(95%UI,10000-11000)死亡,使其成为2017年全球男女性别癌症死亡的第五大主要原因(补编图6)。对于女性而言,乳腺癌是2017年癌症死亡的主要原因(表)。乳腺癌导致两性的DALYs达到1770万(95%UI,16.9-1870万),其中93%来自YLLs和7%来自YLDs(见表15和e图4)。全球,每18名女性中就有1名患有乳腺癌。终生使用(补编中的表16)。在女性中,罹患乳腺癌的几率在高SDI国家中最高(11分之一),在低SDI国家中最低(38分之一)。对于女性而言,乳腺癌是143种最常见的癌症
国家和112个最常见的癌症死亡原因国家(如补编中的图8和图10)。总体而言,事件病例增加了35%(95%UI,30%-39%),原因是人口年龄结构发生了变化(贡献了15%),人口增长(贡献了13%)以及特定年龄段的发病率上升了(贡献了7%) )(例如,附录中的图11)。在2007年至2017年之间,高SDI国家妇女的ASIR下降了,但其他SDI五分位数的妇女则有所上升(补编图12-16)。
4. Colon and Rectum Cancer
In 2017, there were 1.8 million (95% UI, 1.8-1.9 million) incident
cases of colon and rectum cancer, and 896000 (95%UI,
876 000-916 000) deaths (Table). Colon and rectum cancer
caused 19.0 million (95%UI, 18.5-19.5 million) DALYs in 2017,
of which 95% came from YLLs and 5% from YLDs (eTable 15
and eFigure 4 in the Supplement). The odds of developing colon
and rectum cancer globally were higher for men than for
women (1 in 26 formenvs 1 in 40 forwomen) (eTable 16 in the
Supplement). The highest odds were in the high SDI quintile
(1 in 15 for men and 1 in 25 for women) and the lowest in the
low SDI quintile (1 in 81 for men and 1 in 98 for women). Between
2007 and 2017, incidence increased by 38% (95% UI,
34%-41%), from1.3 million (95%UI, 1.3-1.3 million) to 1.8 million
(95% UI, 1.8-1.9 million) cases (eTable 14 in the Supplement).
Most of this increase can be explained by an aging and
growing population (20% and 13%, respectively); however,
even with the same population size and age structure, colorectal
cancer caseswould have increased by 5%between 2007
and 2017 owing to changing age-specific incidence rates. The
ASIRs between 1990 and 2017 are similar formenandwomen
at the global level and for all SDI quintiles (eFigures 12-16 in
the Supplement).
4.结肠癌和直肠癌
2017年,发生了180万起事件(UI为95%,1.8-190万)结肠癌和直肠癌的病例,以及896000(95%UI,876 000-916 000)人死亡(表)。结肠和直肠癌在2017年造成了1,900万(95%的用户体验,18.5-1950万)DALY,其中95%来自YLL,而5%来自YLD(e表15和e补编中的图4)。结肠癌的几率男性的全球直肠癌患病率高于男性女性(26名女性中有1名女性,40名女性中有1名女性)(e表16补充)。最高SDI五分位数的赔率是最高(男性为15分之一,女性为25分之一),低SDI五分位数(男性为81分之一,女性为98分之一)。之间2007年和2017年,发生率增加了38%(UI为95%,34%-41%),从130万(95%用户界面,1.3-130万)增加到180万(95%UI,1.8-190万)案例(补编中的表14)。这种增加的大部分可以通过老化和人口增长(分别为20%和13%);然而,
即使人口规模和年龄结构相同,结直肠癌2007年之间,癌症病例将增加5%和2017年,因为特定年龄段的发病率发生了变化。的1990年至2017年之间的ASIR指标相似在全球范围内以及所有SDI五分位数(e图12-16
补充)。5. Prostate Cancer
In 2017, there were 1.3 million (95% UI, 1.2-1.7 million) incident
cases of prostate cancer and 416000 (95% UI, 357 000-
490000) deaths. Prostate cancer caused 7.1 million (95%UI,
6.1 million-8.4 million)DALYs globally in 2017,with 88%coming
fromYLLs and 12% from YLDs (eTable 15 and eFigure 4 in theSupplement). Globally, theodds ofdevelopingprostate cancerwere
1 in 18, ranging from1 in 52 for lowSDI countries to 1
in9inhigh SDIcountries (eTable 16 in theSupplement). In 2017,
prostate cancer was the cancerwith the highest incidence for
men in 114 countries and the leading cause of cancer-related
deaths formenin 56 countries (eFigures 7 and 9 in the Supplement).
The increasing incidence rates, togetherwith an aging
and growing population, have led to a 42% (95% UI, 37%-
52%) increase in prostate cancer cases since 2007 (940000
[95%UI, 774 000-1.2 million] in 2007 and 1.3 million [95%UI,
1.2-1.7 million] in 2017). Twenty-one percent of this increase
can be attributed to a change in the population age structure,
13% to a change in the population size, and 8%to a change in
the age-specific incidence rates (eTable 14 and eFigure 11 inthe
Supplement).5.前列腺癌
2017年发生了130万起事件(UI为95%,1.2-170万)前列腺癌和416000例病例(95%UI,357 000-490000)死亡。前列腺癌导致710万人(95%用户界面,2017年全球610万-840万)来自YLL的收入和来自YLD的12%(补编中的表15和e图4)。在全球范围内,发展中的前列腺癌的可能性越来越大18分之一,从低SDI国家的52分之一到1在9个SDI高的国家/地区(附录中的表16)。在2017年,前列腺癌是发生率最高的癌症
114个国家/地区的男性是与癌症相关的主要原因56个国家的死亡人数(补编中的图7和图9)。发病率增加,并随着年龄的增长和人口的增长导致了42%(95%用户界面,37%自2007年以来,前列腺癌病例增加了52%(940000[95%UI,774 000-120万],2007年和130万[95%UI,
在2017年[1.2-170万]。增加的百分之二十一可以归因于人口年龄结构的变化,人口规模发生变化的比例为13%,而人口数量变化的比例为8%
特定年龄段的发病率(表14和表11)补充)。
6. Stomach Cancer
In 2017, there were 1.2 million (95% UI, 1.2-1.3 million) incident
cases of stomach cancer and 865000 (95%UI, 848 000-
885000) deathsworldwide. Stomach cancer caused 19.1 million
(95%UI, 18.7-19.6million)DALYs in2017,with98%coming
from YLLs and 2% coming from YLDs (eTable 15 and eFigure
4 in the Supplement). One in 33 men and 1 in 78 women
developed stomach cancer over a lifetime. The highest odds
for men and women were in high-middle SDI countries (1 in 21 and 1 in 57, respectively), and the lowest oddswere formen
in lowSDI countries (1 in 78) and forwomenin low-middle SDI
countries (1 in 104) (eTable 16 in the Supplement). Between
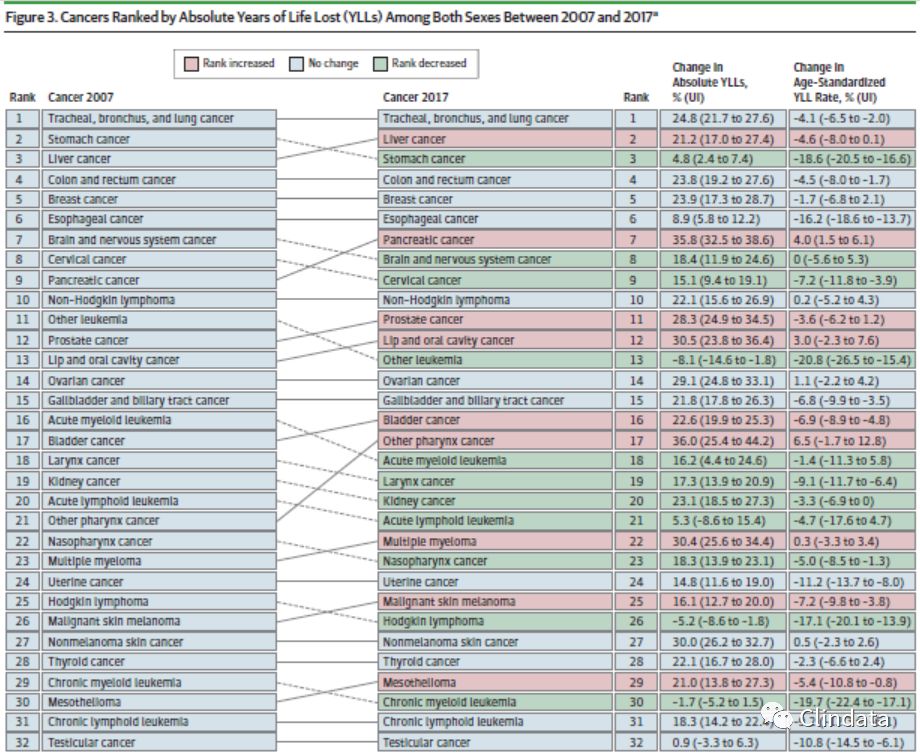
2007 and 2017, stomach cancermoved fromthe second leading
cause of crude cancer YLLs to the third place with a 5%
(95% UI, 2%-7%) increase in absolute YLLs (Figure 3). Overall,
incidence between 2007 and 2017 increased by 25% (95%
UI, 22%-29%), of which a change in the population age structure
contributed 19%, population growth 13%, and falling agespecific
rates ?6% (eTable 14 and eFigure 11 in the Supplement).
TheASIRshavedroppedsubstantially since1990globally
and for all SDI quintiles (eFigures 12-16 in the Supplement).
6.胃癌
2017年发生了120万起事件(UI为95%,1.2-130万)胃癌和865000例病例(95%UI,848 000-885000)。胃癌导致1910万 2017年(95%的用户界面,18.7-1960万)每日平均需求量,即将到来的98%来自YLL的收入和2%来自YLD的收入(e表15和eFigure补编中的4)。33名男性中的1名女性和78名女性中的1名女性一生中会患胃癌。最高赔率男女分别位于SDI的高中国家(分别为21分之一和57分之一),在lowSDI国家(78个国家中有1个)和foromenin中低SDI国家国家(104个国家中的1个)(补编中的表16)。之间2007年和2017年,胃癌从第二名转移到第二名
粗癌症YLL的原因以5%排名第三绝对YLL(95%UI,2%-7%)(图3)。总体,2007年至2017年之间的发病率增加了25%(95%UI,22%-29%),其中人口年龄结构发生了变化贡献19%,人口增长13%,年龄下降比率为-6%(补编中的表14和图11)。自1990年以来,ASIR在全球范围内大幅下降以及所有SDI五分位数(如补编中的图12-16)。7. Liver Cancer
In 2017, there were 953000 (95% UI, 917 000-997000) incident
cases of liver cancer globally and 819 000 (95% UI,
790 000-856 000) deaths. Liver cancer caused 20.8 million
(95% UI, 19.9-21.8 million) DALYs in 2017, with 99% coming
fromYLLs and 1%coming fromYLDs (eTable 15 and eFigure 4
in the Supplement). Globally, liver cancer was more common
inmen,with 1 in42mendeveloping liver cancercomparedwith
1 in 118 women. The highest odds of developing liver cancer
were in high-middle SDI countries for men (1 in 31) and in
middle SDI countries forwomen (1 in 94), whereas the lowest
were seen in lowSDI countries (1 in 98 men and 1 in 177wom-en) (eTable 16 in the Supplement). Population aging and population
growth were the drivers of the increase from 705000
(95%UI, 690000-734000) cases in 2007 to 953000(95%UI,
917 000-997000) cases in 2017 (eTable 14 and eFigure 11 inthe
Supplement). Of the 35%increase in cases between 2007 and
2017, 17% was due to population aging, 13% due to population
growth, and 6% due to an increase in age-specific incidence
rates.7.肝癌
2017年,发生了953000(95%UI,917 000-997000)事件全球和819 000例肝癌病例(95%UI,790 000-856 000)死亡。肝癌导致2080万
(95%UI,19.9-2180万)2017年DALY,其中99%即将到来来自YLL的收入和来自YLD的收入的1%(e表15和e图4在补编中)。在全球范围内,肝癌更为普遍男性,其中42例男性患上肝癌118名女性中有1名。患肝癌的几率最高在SDI的中高等国家/地区(31分之一)和SDI中部国家为女性(94个国家中的1个),而最低在低SDI国家(98名男性中有1名,177wom-en中有1名)中被发现(补编中的表16)。人口老龄化与人口
增长是705000增长的驱动力(95%UI,690000-734000)案例从2007年的953000(95%UI,2017年有917 000-997000例)(表14和表11)
补充)。在2007年到2007年之间,案件增加了35%2017年,人口老龄化占17%,人口老龄化占13%增长,而6%由于特定年龄段的发生率增加
费率。
8. Cervical Cancer
In 2017, 601 000 (95% UI, 554 000-625 000) women developed
cervical cancerworldwide, and it caused 260000 (95%
UI, 241 000-269000) deaths (Table). Cervical cancer caused
8.1 million (95%UI, 7.5-8.4 million) DALYs,with 96%coming
from YLLs and 4% from YLDs (eTable 15 and eFigure 4 in the
Supplement). Globally, 1 in 65womendeveloped cervical cancer
during a lifetime (eTable 16 in the Supplement). The odds
were the highest in lowSDI countries (1 in 40) and the lowest
in high SDI countries (1 in 106). In 2017, cervical cancer was
the most common incident cancer forwomen in 50 countries
(eFigure 8 in the Supplement) and the mostcommoncause of
cancer deaths in 39 countries (eFigure 10 in the Supplement).
Between 2007 and 2017, incident cases increased by19%(95%
UI, 13%-23%) globally. Population growth contributed 13% and
population aging 9%, while falling age-specific incidence rates
offset this increase by ?3% (eFigure 11 and eTable 14 in the Supplement).Deaths increased by 19% (95%UI, 13%-23%) between 2007 and 2017, and DALYs by 15%(95%UI, 10%-19%).
The ASIRs decreased globally and for all SDI quintiles (eFigures
12-16 in the Supplement).8.宫颈癌
2017年,发展了601 000名女性(95%UI,554 000-625 000)
全世界的子宫颈癌,造成了260000(95%UI,241 000-269000)死亡(表)。宫颈癌引起的810万(95%用户界面,7.5-840万)DALY,即将到来的96%YLL和YLD的4%(e表15和e图4补充)。在全球范围内,每65名女性中就有1名患有宫颈癌一生中(补编中的表16)。赔率在低SDI国家中最高(40个国家中有1个),最低在高SDI国家(106个国家中有1个)。2017年,宫颈癌50个国家/地区中最常见的意外癌症女性(如补编中的图8)和最常见的原因39个国家的癌症死亡人数(补编中的图10)。在2007年至2017年之间,事件案例增加了19%(95%UI,全球范围内为13%-23%)。人口增长贡献了13%,人口老龄化9%,特定年龄段的发病率下降抵消了?3%的增长(补编中的图11和表14).2007年至2017年间死亡增加了19%(95%UI,13%-23%),DALYs增长了15%(95%UI,10 %-19%)。全球和所有SDI五分位数的ASIR下降(eFigures补编中的12-16)。9. Non-Hodgkin Lymphoma
In 2017, therewere 488000 (95%UI, 479 000-497000) incident
cases of non-Hodgkin lymphoma and 249000 (95%UI,
243 000-253000) deaths.Non-Hodgkinlymphomacaused 7.0
million (95%UI, 6.8-7.2 million)DALYs in2017,with97%coming
from YLLs and 3% from YLDs (eTable 15 and eFigure 4 in
the Supplement). Globally, 1 in 108 men and 1 in 162 women
developed non-Hodgkin lymphoma over a lifetime. The highest
odds were in high SDI countries (1 in 54 for men and 1 in
80 for women) and the lowest in low SDI countries (1 in 221
for men and 1 in 322 for women) (eTable 16 in the Supplement).
Globally, incident cases between 2007 and 2017 increased
by 39% (95%UI, 35%-42%), of which 15%was due to
changing population age structure, 13% due to population
growth, and 11% due to change in incidence rates (eTable 14
and eFigure 11 in the Supplement).9.非霍奇金淋巴瘤
在2017年,发生了488000(95%UI,479 000-497000)事件
非霍奇金淋巴瘤和249000例病例(95%UI,243 000-253000)死亡。非霍奇金淋巴瘤引起7.0 2017年有100万(95%UI,6.8-720万)DALYs,即将到来的97%YLL和YLD的3%(e表15和e图4补充)。 在全球范围内,男性每108个人中就有1个人,女性每162个人中就有1人一生中发展为非霍奇金淋巴瘤。 最高的SDI较高的国家/地区的赔率较高(男性54分之1,男性1分之1妇女中80名女性)和低SDI国家中最低的女性(221名女性中的1名)男性和322名女性中有1名女性)(附录中的表16)。在全球范围内,2007年至2017年之间的事件案例有所增加减少了39%(95%UI,35%-42%),其中15%是由于不断变化的人口年龄结构,由于人口原因,这一比例为13%增长,而11%是由于发生率的变化(表14
和e附录中的图11)。10. Bladder Cancer
In 2017, therewere 474000 (95%UI, 462 000-492000) incident
cases of bladder cancer and 197000 (95% UI, 192 000-
206000) deaths. Bladder cancer caused 3.6 million (95%UI,3.5-3.8million)DALYs in2017,with93%coming fromYLLs and
7% from YLDs (eTable 15 and eFigure 4 in the Supplement).
Globally, 1 in 74 men and 1 in 301 women developed bladder
cancer over a lifetime. The highest oddswere in high SDI countries
(1 in 42 for men and 1 in 185 for women) and the lowest
in lowSDI countries (1 in 198 for men and 1 in 489 forwomen)
(eTable 16 in the Supplement). Globally, incident cases between
2007 and 2017 increased by 32% (95% UI, 30%-35%),
of which 20% was due to changing population age structure
and 13% to population growth (eTable 14 and eFigure 11 in the
Supplement).10.膀胱癌
2017年,发生474000(95%UI,462 000-492000)事件和197000例膀胱癌病例(95%的用户界面,19.2万206000)死亡。 2017年,膀胱癌引起了360万(95%UI,3.5-380万)DALYs,其中93%来自青年和青少年来自YLD的7%(附录中的表15和图4)。在全球范围内,每74名男性中有1名女性和301名女性中有1名女性患有膀胱一生中都会患癌症。 高SDI国家/地区的赔率最高(男性为42分之一,女性为185分之一),最低
在低SDI国家(男性198分之一,女性489分之一)(补编中的表16)。 在全球范围内,2007年和2017年增长了32%(用户界面95%,30%-35%),其中20%是由于人口年龄结构的变化占人口增长的13%(e表14和e图11补充)。
Cancer in Comparison to Other Diseases
Within the 22 mutually exclusive and collectively exhaustive
GBD level 2 disease categories (eTable 17 in the Supplement),
neoplasms rankedlast for incidence in1990and2017 (eTable 18
in the Supplement). For prevalence, neoplasms ranked last in
1990 but surpassed enteric infections in 2017. The YLDs ranking
for neoplasms also increased between 1990 and 2017 from
the 21st to the 19th position. Mortality due to neoplasms remained
at the second place between 1990 and 2017. The largest
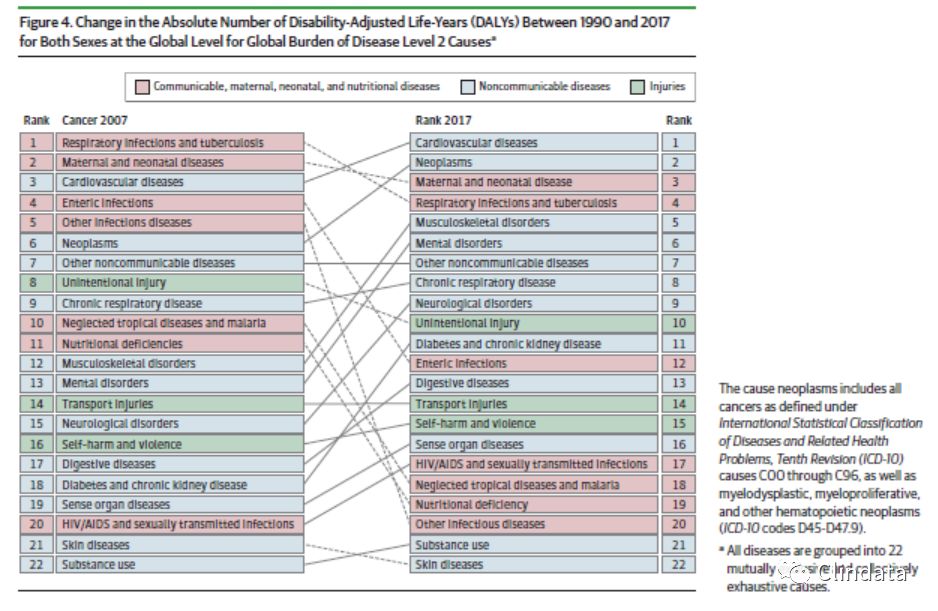
increase was seen for neoplasm YLLs and DALYs, which increased
fromthe sixth place in 1990 to the second place in 2017
after cardiovascular diseases (Figure4).The4causeswith higher
DALYs in 1990 that had been surpassed by neoplasms in 2017
are respiratory infections and tuberculosis, maternal and neonatal
disorders, enteric infections, and other infections.
癌症与其他疾病的比较
在22个相互排斥且集体详尽的内部GBD 2级疾病类别(补编中的表17),肿瘤在1990年和2017年的发病率中排名倒数第二(e表18
在补编中)。 就患病率而言,肿瘤排在最后1990年,但在2017年超过肠道感染。YLD排名在1990年至2017年期间,第21位到第19位。 肿瘤导致的死亡率仍然存在在1990年至2017年之间排名第二。肿瘤YLL和DALYs增加,这增加了从1990年的第六名到2017年的第二名心血管疾病发生后(图4)。1990年的DALYs在2017年被肿瘤超越是孕妇和新生儿的呼吸道感染和肺结核疾病,肠感染和其他感染。
Discussion
The GBD study results are updated on an annual basis. In this
articlewe focus on changes over the past decade and present
the most recent results fromthe GBD 2017 study using cancer
registry, vital registration, and verbal autopsy data to estimate
theburdenof cancer for 195 countriesandterritories from
1990 through 2017.13,14 All results presented can also be found
online at https://vizhub.healthdata.org/gbd-compare/ and
http://ghdx.healthdata.org/gbd-results-tool.For this article,we
also compare cancer burden with other diseases.
讨论
GBD研究结果每年更新一次。 在这文章我们关注过去十年和现在的变化
GBD 2017研究中使用癌症的最新结果注册表,生命登记和口头验尸数据以进行估计195个国家和地区的癌症负担1990年至2017.13,14还可以找到所有呈现的结果在线https://vizhub.healthdata.org/gbd-compare/
http://ghdx.healthdata.org/gbd-results-tool。对于本文,我们还将癌症负担与其他疾病进行比较。
The GBD 2017 results show that there are 24.5 million
incident cancer cases worldwide (16.8 million without
NMSC) and 9.6 million deaths, which is similar to the latest
GLOBOCAN estimates for 2018 that estimate 17.0 million
cases (without NMSC) and 9.4 million deaths.15
The largest change in our estimates comparedwith the last
iteration of the GBD study (GBD 2016) are the incidence
estimates for NMSC, which have substantially increased.
Despite being the most common incident cancer in many
populations, cancer registry data to inform incidence
estimates are often unreliable or nonexistent. For GBD 2017
we have therefore used Marketscan data for the United States,
which has led to substantially higher estimates for NMSC.16
A key strength of the GBD study is the comparative
health assessment. Our analysis shows how cancer has
increased in importance as a global health problem. Although
it ranked sixth in 1990 among the top causes for DALYs
worldwide, it has risen to the second place in 2017 behind
cardiovascular diseases. Cancer now occupies the second
place in the ranking of global deaths, YLLs, and DALYs, and is
among the top 2 leading causes of deaths, YLLs, and DALYs in
the highest 3 SDI quintiles. This shift in disease burden owing
to the demographic and epidemiological transitions has
important implications on health policy: ensuring access to
universal health coverage and protection against catastrophic
health expenditure directly related to the cancer treatment,
but also against the long-term costs associated with a cancer
diagnosis for a household, has to be prioritized.17 Fifty percent
of cancer cases occur in high SDI countries, but only
30% of cancer deaths, 25% of cancer DALYs, and 23% of cancer cancer
YLLs. To ensure sustainable global development,
increased efforts are needed to reduce these health inequalities.
Recognizing the strong interdependencies between
socioeconomic status and health and the large contribution
of cancer to the overall disease burden is a first step in making
investments in cancer prevention and treatment a
priority.18 Cervical cancer is likely the best example of
inequalities in cancer with vast differences in burden by SDI.
As a completely preventable cancer where cost-effective
vaccination3 and screening approaches are available, cervical
cancer has recently gained global attention through the
World Health Organization’s call for elimination.19 Falling
incidence rates in all SDI quintiles are encouraging, but countries
with the least resources are still facing the largest burden
because of lack of screening programs. Immunization
against human papillomavirus, screening, and treatment of
cervical cancer is therefore of utmost importance in all socioeconomic
settings.
Deaths due to cancer contribute the majority of total
health loss measured in DALYs, with disability contributing
less than 12% for all cancers. As access to cancer care
increases and treatments improve, cancer mortality
decreases, but prevalence and disability in the survivor
population increase, which is already the case in some highincome
countries.20 The World Health Organization Global
Action Plan for the Prevention and Control of NCDs and the
United Nations Sustainable Development Goals focus on the
reduction of premature mortality as the first goal. At the
same time, infrastructure should be planned that can address
the growing survivor population’s need.
Limitations
The most important limitation for the GBD, as for other disease
burden estimation, is the lack of data for many locations.
A key GBD principle is to take advantage of all relevant
data sources. This means for cancer estimation that incidence
data fromcancer registries, aswell as mortality data from
vital registration systems or verbal autopsies, is used to produce
disease burden estimates. Despite these broad inclusion
criteria for different types of data sources, certain locationshave
neither of thesedata sources available,andestimates
rely either on predictive covariates or trends from neighboring
locations. Also, diagnostic accuracy for cause of death data
and ascertainment bias in cancer registries remains a limitation,
which requires corrections for underregistration and
redistribution algorithms for insufficiently specific or implausible
diagnostic codes. Because of a lag in data availability, estimates
for the most recent years are based on past time trends
and covariates rather than data, which is reflected in larger
uncertainty. Scarcity of reliable survival data worldwide
requires the estimation of survival based on the mortality-toincidence
ratio, which is a surrogate for survival. Because in
the majority of deaths due to Kaposi sarcoma the underlying
cause of deaths is AIDS, deaths and incidence of Kaposi
sarcoma are not estimated in the GBD. Also, common
pediatric cancers are not estimated separately in the GBD and
are estimated under the aggregated cause “other malignant
neoplasms.”
GBD 2017结果显示2,450万全球发生癌症的事件(1680万例NMSC)和960万人死亡,这与最新的GLOBOCAN估计2018年估计为1,700万病例(无NMSC)和940万人死亡15。与上一次相比,我们的估算值变化最大
GBD研究(GBD 2016)的迭代是发生率对NMSC的估计,它已经大大增加了。尽管是许多人中最常见的意外癌症人群,癌症登记数据可告知发病率估算值通常不可靠或不存在。对于GBD 2017因此,我们使用了美国的Marketscan数据,这导致对NMSC.16的估计大大提高GBD研究的一个关键优势是比较健康评估。我们的分析表明癌症如何作为全球健康问题的重要性日益提高。虽然在1990年DALY的主要原因中,它排名第六在全球范围内,它在2017年已升至第二位,仅次于心血管疾病。癌症现在占第二位在全球死亡人数,YLL和DALY的排名中处于第在以下两个主要的死亡原因中:YLL和DALY最高的SDI五分位数。由于疾病负担的这种转移到人口和流行病学转变对卫生政策的重要影响:确保获得全民健康覆盖并预防灾难与癌症治疗直接相关的健康支出,而且还可以抵销与癌症相关的长期费用必须优先考虑对家庭的诊断。1750%癌症病例发生在高SDI国家,但仅30%的癌症死亡,25%的癌症DALY和23%的癌症YLL。为了确保全球可持续发展,需要加大努力以减少这些健康不平等现象。
认识到两者之间的强烈相互依存关系社会经济地位与健康的巨大贡献癌症对整体疾病负担的影响是迈出的第一步癌症预防和治疗方面的投资a
优先权。18宫颈癌可能是SDI负担巨大的癌症之间的不平等。作为完全可预防的癌症,具有成本效益可以使用疫苗接种3和筛查方法,宫颈癌症最近通过世界卫生组织呼吁消除种族主义19所有SDI五分位数的发病率都令人鼓舞,但各国资源最少的人仍然面临最大的负担由于缺乏筛查程序。免疫接种抗人乳头瘤病毒,筛查和治疗因此,宫颈癌在所有社会经济领域都至关重要设置。
癌症死亡占总数的大部分以残疾调整生命年计量的健康损失,残疾所有癌症的比例均低于12%。作为获得癌症护理的途径增加和治疗改善,癌症死亡率减少,但幸存者的患病率和残疾人口增加,在某些高收入国家已经是这种情况国家。20世界卫生组织全球预防和控制非传染性疾病行动计划以及联合国可持续发展目标侧重于降低过早死亡率是首要目标。在同时,应该规划可以解决的基础架构越来越多的幸存者需求。局限性 与其他疾病一样,GBD最重要的局限性负担估算是许多地方缺乏数据。GBD的关键原则是要充分利用所有相关数据源。这意味着对于癌症的估计来自癌症登记处的数据以及来自生命登记系统或口头验尸被用来生产
疾病负担估算。尽管这些广泛的包容性不同类型数据源的标准,某些位置必须剃须这些数据源都不可用,并且估计依靠预测协变量或邻近趋势
位置。此外,还可以确定死亡原因数据的诊断准确性并且癌症登记处的确定性偏见仍然是一个局限,需要针对注册不足进行更正,重新分配算法以解决不够明确或难以置信的问题诊断代码。由于数据可用性滞后,估计最近几年基于过去的时间趋势和协变量而不是数据,这反映在不确定。全球缺乏可靠的生存数据需要基于死亡率的估计生存率比率,这是生存的替代指标。因为在由于卡波济肉瘤而导致的大多数死亡是潜在的
死亡的原因是艾滋病,死亡和卡波济的发病率GBD中未估计肉瘤。另外,常GBD和GBD中未单独估算儿童癌症估计是由于“其他恶性”肿瘤。Conclusions
The national epidemiological profiles of cancer burden in the
GBD study show large heterogeneities, which are a reflection
of different exposures to risk factors, economic settings, lifestyles,
and access to care. TheGBDstudy can be used by policy
makers and other stakeholders to develop and improve local
cancer control in order to achieve the global targets and
improve equity in cancer care.
结论
全球癌症流行病学概况GBD研究显示出较大的异质性,这反映了不同的风险因素,经济状况,生活方式,和获得护理。 GBD研究可由政策使用制造商和其他利益相关者开发和改善本地为了实现全球目标而控制癌症提高癌症治疗的公平性。

参考文献Global, Regional, and National Cancer Incidence, Mortality, Years of Life Lost, Years Lived With Disability, and Disability-Adjusted Life-Years for 29 Cancer Groups, 1990 to 2017A Systematic Analysis for the Global Burden of Disease Study, JAMA Oncol. Published online September 27, 2019. doi:10.1001/jamaoncol.2019.2996.